An Inside Look At Why Sears and Kmart Never Turned The Corner

Longtime readers of this blog will remember that for a while I was a believer in Eddie Lampert's ability to breathe new life into Kmart and Sears by more efficiently allocating capital within the companies. I started writing about the investment idea in 2005 and followed up probably a dozen or two times over the years. Although the investment was a profitable one for me and my clients (I sold long ago after it was obvious that Lampert was not going in the same direction as many of us had expected), it was also one of the most frustrating investing situations I can remember because so much potential was squandered. Had Lampert used the profits from Kmart and Sears (yes, they actually did make decent money for a while under his ownership) to diversify into other, more attractive businesses, Sears Holdings could have been a huge success. Instead, he honestly believed that a hedge fund manager could run a retailer (from his office in Connecticut) better than retailing veterans could from the company's headquarters outside Chicago (he has not).

If you are interested in some of the behind the scenes that has gone on at Sears and Kmart in recent years (it's been an absolute debacle), Bloomberg BusinessWeek has published an excellent article that can be found at the link below:

At Sears, Eddie Lampert's Warring Divisions Model Adds To The Troubles

It's a great read. And no, the stock is not a bargain today. At the current price ($45 per share), the company has an equity value of $5 billion and another $3 billion of net debt. I can't see how the enterprise is worth $8 billion. That said, the company's debt looks interesting (I think it's money good).

Full Disclosure: Long Sears Holdings bonds at the time of writing, but positions may change at any time

Housing Market Unlikely To Be Derailed Significantly By Higher Rates Anytime Soon

With 30-year mortgage rates having risen by a full percentage point in recent weeks, investors are selling homebuilder stocks on fears that the rebound in prices that has been in place for over a year will come to a screeching halt. But is that really the correct takeaway with mortgage rates still sitting at just 4.5%? I'm not so sure.

While there is no doubt that rising rates will cut into refinance activity in a major way, I do not think the thesis for being bullish on housing demand is dented by the recent rate increase. The main reason is because I do not think the housing market rebound was as much due to falling rates as it was the structural normalization of the supply/demand picture within housing more generally.

Let's think about this. The dramatic collapse in housing prices (down 30% peak-to-trough nationally) was caused by the simultaneous divergence of supply and demand. Demand for new homes collapsed during the recession due to soaring unemployment and general economic uncertainty, both of which reduced the desire to buy a new home. And many of those who actually wanted to buy could not get a loan because the banks were in retreat, just trying to manage through the downturn and stem their credit losses. At the same time, housing supply was soaring due to record foreclosure rates, which flooded the market with homes available for sale, despite the lack of buyer demand. Those two factors combined meant that home prices had nowhere to go but down, and the drop was precipitous.

So what has been behind the rebound in home sales and prices since the housing market bottomed nationally in 2012? Was it just mortgage rates going from 5% to 4% to 3.5%? Was it a loosening of credit standards? To an extent, sure, both of those factors contributed to some of the turnaround. However, I believe other factors had more of an impact.

For instance, for several years the industry essentially stopped building to allow the market to absorb all of the foreclosures. Now that foreclosures have dropped dramatically, the builders have begun to really crank up new home construction. In addition, demand has been helped by a combination of loosening credit standards and an improving employment picture. As a result, home demand is rising as new households are formed and they are in a position (both from a financial and underwriting perspective) to not only qualify for a new home loan, but also afford one.

My main point here is that the demand for housing now has less to do with interest rates and more to do with household formation and the ability to get and pay for a mortgage. That should be the case even if mortgage rates are 5% (instead of 3.5% or 4%) because those rates are still very low on a historical basis and do not really flip the home affordability equation away from buying. If 30-year mortgage rates went to 8% the story might change, but that is simply not in the cards. If I am right and the housing market rebound has more to to with underlying structural supply and demand trends than interest rates, then the housing uptrend should continue even if rates go up a bit more in the coming months. In that scenario, the homebuilders will continue to see volumes and profit margins increase, which will support stronger stock prices than the stock market is pricing in right now.

Time To Make A Shopping List

It's one thing to say that interest rates will eventually go up, and it's something entirely different to see them actually start to rise. Over the last couple of weeks the stock and bond markets have been spooked as the benchmark 10-year treasury has seen its yield spike. Since May 1st, the 10-year yield is up 100 basis points, from 1.6% to 2.6%. In percentage terms, that is a huge move, which is why the markets have been rattled.

It is also a fairly uncommon situation to find the stock and bond markets falling at the same time, as equity outflows typically are redirected into bonds as a safe haven. However, the rise in stocks in recent memory has largely been helped by falling bond yields (which make equities more attractive on a relative basis), so it makes sense that when bonds start to sell-off, causing rates to rise, that it would also cause a retracement in recent equity gains. So, we have bonds and stocks dropping simultaneously, and in many cases, bonds actually falling more than stocks, which hardly ever happens.

So what do we do as long-term investors? First, let's keep things in perspective. Rather than simply focus on your stock and bond returns in May and June, consider them in the context of the last several years. While we are finally having a market correction, it should have been expected (though the exact timing is always hard to gauge). Healthy markets need to pull back every once in a while to avoid overheating. This time is no different. In fact, it had been a record number of trading days since we last had a 5% correction, so we should not fret too much at the market's recent action.

With yield-sensitive securities leading the way down, should we throw in the towel and pronounce income-investing and the dividend-paying stock bull market dead? I would not be so quick to judge. Does a stock yielding 4% or 5% look a bit less attractive if bonds yield 2-3% instead of 1-2%? Sure. Does that mean the merits of owning high-yielding stocks have simply vanished? Hardly. Many MLPs and REITs are seeing their yields jump to 6-7% again. Even if interest rates rose another percentage point, those securities will remain attractive in the big picture.

I would suggest making a shopping list of your favorite stocks and bonds. At a certain price they become very attractive and are likely ripe for purchase during this correction. Many reached fair value, or even surpassed it a bit, thanks to interest rates hitting record lows. That was bound to stop at some point, and now the market is re-calibrating its expectations that rates will not stay ultra-low forever. We may have already known that, but markets don't typically react until the move higher begins. And investors can expect that market prices will adjust to even higher rates ahead of time, since the financial markets are discounting mechanisms. In fact, we are likely seeing that process play out right now.

Gold: It's Just Yellow Metal

Henry Blodget said it perfectly in an article published on Thursday ("Gold Prices Collapse As Everyone Remembers It's Just Yellow Metal"). Now that the financial crisis is over and the U.S. economy is normalizing (albeit slowly), gold is no longer an asset class that makes much sense to many who have loved it in the recent past. Gold has no inherent intrinsic value, so buyers are merely hoping that others will buy it from them at a later date for more than they initially paid. There is no claim on any assets, which could increase in value over time (unlike a share of stock which represents a piece of ownership in a money-making corporation). Some people say gold is a currency, and yet you cannot deposit it into your checking account or use it to buy goods at your local store.

In fact, the recent strength in the U.S. stock market, coupled with severe weakness in gold prices, has resulted in stocks now having beaten gold since 2009. It took some time, but fundamentals do matter again. See the chart below:

gld-vs-spx.png

Biglari Stake Pushes Cracker Barrel Management Into A Corner

Shares of restaurant operator Cracker Barrel Old Country Store (CBRL) are jumping $4 today to new all-time highs on the heels of a strong quarterly earnings report and news that it will raise its dividend by 50% to $3.00 per year, giving the $93 stock a yield of over 3%. While I do not own CBRL shares directly, Biglari Holdings (BH) is a large position in the client accounts I manage and that company owns a 20% stake in Cracker Barrel, after having started buying the stock in the 40's two years ago. That stake is now worth over $440 million and represents a majority of BH's current equity market value of $585 million.

I have written about Biglari Holdings quite a bit previously, so I suggest searching this blog for those articles if you would like to learn more on that front. What I find interesting today is that Biglari has really cornered Cracker Barrel into a position where Biglari and its shareholders can win on multiple fronts with its CBRL investment. The Biglari-Cracker Barrel relationship is a dicey one, which is contrary to many situations where a company and its largest shareholder communicate amicably on a fairly regular basis. As a 20% holder, Biglari has agitated for board seats for two years now, and has been rejected by both management and CBRL shareholders both times. Biglari's main beef was with how CBRL was being managed, and as a large holder he wanted to sit down with the senior management team and work together to improve capital allocation and get the stock price higher.

Interestingly, Cracker Barrel has been quick to dismiss Biglari's ideas publicly, only to later implement them and try and take credit. Many of those changes have contributed to the doubling of CBRL's share price over the last two years. Now that CBRL is generating excess free cash flow at a very healthy clip, they are faced with the decision of how to allocate that capital. Previously CBRL has repurchased shares, but now that Biglari Holdings owns 20% of the company (the maximum amount it can own due to a poison pill put into place by Cracker Barrel management) any share repurchases would increase Biglari's stake in the company without any additional cash investment. If that stake were to rise, Biglari's odds of gaining seats on the company's board of directors would also increase, and given the tense relationship, CBRL has no incentive to buy back stock right now.

So that leaves the issue of the company's dividend. When Biglari Holdings bought its first shares of Cracker Barrel in 2011, CBRL's quarterly dividend was 22 cents per share. Since then they have raised it on four separate occasions, more than tripling the payout to the current 75 cents per quarter rate. Cracker Barrel likely thought doing so would make Biglari happier and might cause him to be less vocal. However, that has not happened and there is every indication that he will continue to seek board seats in the future.

From Biglari's perspective, he really could not be in a better position. If Cracker Barrel hoards its cash or spends it unwisely (unprofitable unit expansion has been a core tenet of Biglari's critique), he will likely get more shareholders on his side when it comes time to re-elect the company's directors. If CBRL decides to buy back shares with its free cash flow (something Biglari has suggested they do), his ownership percentage will increase and help him in that quest.

Not surprisingly, Cracker Barrel has opted for the dividend increase approach, as it eases shareholder concerns generally and does nothing to help Biglari get on the company's board. However, it serves to funnel cash right into Biglari Holdings' bank account. So shareholders of Biglari Holdings are going to win either way; they benefit from the torrid pace of the stock price's ascent, and they are getting ever-rising dividend payments every quarter, with which Biglari can make additional investments. On BH's 4+ million share stake, that equates to over $12 million a year in dividends, which comes to about 2% of Biglari Holdings' market value.

I'll make one final observation as it relates to the merits of Biglari Holdings as an investment, since I am playing this scenario indirectly through BH stock. Before BH even purchased its first share of CBRL, its stock was trading at $400 per share. Now, two years later with that stake in CBRL worth over $440 million (and paying $12 million out annually), BH shares trade for $405. The market has not yet fully appreciated what Biglari has been building here, but I think it will just be a matter of time.

Full Disclosure: Long BH shares at the time of writing, but positions may change at any time

Sears: The Break-Up Plan Continues Without Any Payoff For Equity Holders

Sears Holdings (SHLD) continues its unofficial, informal break-up plan as it struggles to maintain adequate liquidity amid a money-losing core business. The company's stock is the largest loser in the S&P 500 today as first quarter results showed EBITDA of about break-even. Chairman and majority shareholder Eddie Lampert has assumed the CEO position, but without any direct retail experience even a very smart investor is unlikely to lead a successful turnaround.

The latest tidbit from Sears is that they are contemplating a sale of their asset protection business. Sears is one of the only large retailers that actually offers extended warranties in-house (as opposed to partnering with a financial services company), giving it another asset it could sell or spin-off in order to realize value for shareholders. The company publicly stated yesterday that it believes the business to be worth in excess of $500 million. While breaking up Sears Holdings is the right decision for shareholders, several of the company's first moves in that realm have not really helped boost the share price, mainly because the underlying business is so bad that all sale proceeds (Sears Hometown and Outlet Store spin-off, Orchard Supply IPO, Sears Canada share sale, etc) are merely offsetting those losses and not adding any value on a per-share basis.

Even after today's drubbing, Sears' stock still has a total market value of $5 billion. Add in nearly $3 billion of net debt and I simply cannot justify an $8 billion enterprise value for Sears Holdings in its current form. Not only that, but the company keeps selling off its most profitable segments (because the other ones aren't profitable, read: valuable), which leaves them with a set of even more unattractive assets on a relative basis.

While I do not want to invest in SHLD common shares at $48 a share (it would have to drop into the 30's for me to become even mildly intrigued), I think the company will slug along for many more years. As a result, the company's debt may be a much smarter investment than the common shares. Long-term debt excluding leases totals about $1.6 billion. The majority of that consists of $1.24 billion of 2018 senior notes that pay a coupon of 6.625% per year. At current prices, Sears' long-term debt yields about 7%, which is a very solid return for a five-year debt security.

Full Disclosure: Long Sears long-term debt securities at the time of writing, but positions may change at any time

Netflix and Tesla: Early Signs of Froth in a Bull Market

It is quite common for a bull market to last far longer than many would have thought, and even more so after the brutal economic downturn we had in 2008-2009. Only just recently did U.S. stocks surpass the previous market top reached in 2007. Although it does not mean that a correction is definitely imminent, the current stock market rally is the longest the U.S. has ever seen without a 5% correction. Ever. Dig deeper and we can begin to see some froth in many high-flying market darlings. Fortunately, we are not anywhere near the bubble conditions of the late 1990's, when companies would see their share prices double within days just by announcing that they were launching an e-commerce web site. However, some of these charts have really taken off in recent weeks and I think it is worth mentioning, as U.S. stocks are getting quite overbought. Here are some examples:

TESLA MOTORS - TSLA - $30 to $90 in 4 months:

tsla.gif

NETFLIX - NFLX - $50 to $250 in 8 months:

nflx.gif

GOOGLE - GOOG - $550 to $920 in 10 months: 

goog.gif

You can even find some overly bullish trading activity in slow-growing, boring companies that do not have "new economy" secular trends at their backs, or those that were left for dead not too long ago:

BEST BUY - BBY - $12 to $27 in 4 months:

bby.gif

CLOROX - CLX - $67 to $90 in 1 year:

clx.gif

WALGREEN - WAG - $32 to $50 in 6 months: 

wag.gif

Ladies and gentlemen, we have bull market lift-off. My advice would be to pay extra-close attention to valuation in stocks you are buying and/or holding at this point in the cycle. While the P/E ratio for the broad market (16x) is not excessive (it peaked at 18x at the top of the housing/credit bubble in 2007), we are only 15-20% away from those kinds of levels. Food for thought. I remain unalarmed, but definitely cautious to some degree nonetheless, and a few more months of continued market action like this may change my mind.

Full Disclosure: No positions in any of the stocks shown in the charts above, but positions may change at any time

CBO Projects U.S. Budget Problem Solved For Now

It's amazing what some tax hikes coupled with spending cuts can do for a $1.1 trillion annual budget deficit (just kidding... actually, it's pretty logical). The Congressional Budget Office (CBO), the leading group of nonpartisan budget number-crunchers, now projects that the U.S. federal budget deficit will shrink by an astounding 41% this year, from $1.087 trillion to $642 billion. The reason? Tax receipts are rising faster than expected. Couple that with budget cuts and the result is a huge dent in the annual funding gap for the federal government.

Even more important than a one-year annual decline is the trend CBO sees for the next decade. Here is a chart of their annual deficit projections through 2023:

deficitsbillions.png

As you can see, the deficit hits bottom in 2015, so this (falling deficits) is not a one-time 2013 event. Now, you may look at the rest of that chart and conclude that the good times will be short-lived, as the deficit climbs back to about $900 billion by 2022. If you are just looking at the absolute numbers alone, that would be concerning. However, we need to remember that the deficit as a percentage of GDP is what matters. Somebody making a $1 million a year, for instance, can afford a $10,000 per month mortgage payment. Somebody making $50,000 a year cannot. The ability to carry debt and service it adequately depends on how much money you have to work with, making the absolute numbers meaningless without context.

So what do the above numbers look like if we look at the deficit as a percentage of annual U.S. GDP? Here is that chart:

deficitspctgdp.png

The key number here is the last bar, which shows that the average deficit over the last 40 years (1973-2012) has been 3.1% of GDP. All of the sudden those later years don't look so scary, even though from 2015 to 2022 the deficit nearly doubles on percentage terms.

Now, it is certainly true that if we do nothing to adjust the long-term Social Security or Medicare payments we are scheduled to make, then the deficit will become a huge problem again down the road. However, it is very important to understand from an investing perspective (and possibly from a political one as well), that over the next decade we really will not have a debt problem as long as current law remains in effect and the CBO's baseline assumptions about the economy are close to accurate. Although plenty of people hated the tax hikes and/or the budget cuts that took effect this year, they are doing wonders for our debt problem. Personally, I'll take longer term gains with shorter term pains anytime, if the alternative is the exact opposite.

Qualcomm Now Hoarding More Cash Than Apple On Relative Basis

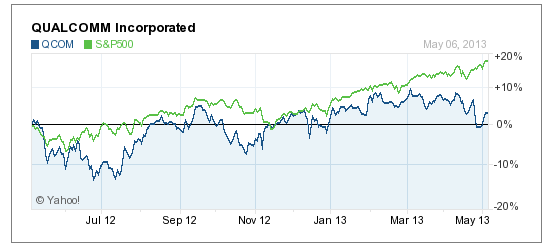
Qualcomm (QCOM), the leading provider of chipsets for wireless consumer devices, has seen its stock price underperform the S&P 500 index over the last year (see chart below), which could prompt shareholders to get more vocal about the company's sub-optimal capital allocation practices later this year. We have seen with Apple that hoarding capital can negatively impact the multiple that investors are willing to pay for a company's shares. In fact, Apple's stock has rebounded nicely in recent weeks, after the company announced it was increasing the size of its share repurchase program by 500%, from $10 billion to $60 billion.

QCOMvsSPX.png

Believe it or not, Qualcomm's cash hoard has eclipsed the $30 billion mark as of March 31st, though the company has no debt. On a relative basis, this is actually more anti-shareholder than Apple. QCOM's cash amounts to 1.4 times the company's annual revenue, 4 times annual cash flow, and more than 26 years' worth of capital expenditures. Compare that to Apple's $145 billion of cash as of March 31st, which comes to 0.85 times annual revenue, 2.5 times annual cash flow, and more than 14 years' worth of capital expenditures.

For investors interested in Qualcomm as an investment, the future will clearly be impacted by how (or if) the company's capital allocation actions change over time. Just as Apple's share price plunge from over $700 to under $400 resulted in a louder chorus from investors about the return of cash, continued underperformance by QCOM stock might just have the same impact. The company certainly does not need $30 billion of cash sitting in the bank.

Full Disclosure: Long Apple and no position in QCOM at the time of writing, but positions may change at any time