Despite Run on SVB, Bank Deposits Appear Safer Than Long-Dated Treasuries

Given the dramatic events of the last week in regional bank land, I will share a few points that I think are interesting given where we stand right now.

1) The $250,000 insurance limit is a mirage

There is a lot of discussion about the FDIC insured deposit limit of $250,000 (whether it is high enough, should be raised, etc) but let’s be honest, the limit is meaningless. The U.S. government has repeatedly shown it is willing to take extraordinary steps to prevent cracks in the financial system from cascading into catastrophe. It only took a weekend for leadership to guarantee 100% of all deposits held with Silicon Valley Bank and Signature Bank. Thus, in this political climate, there does not seem to be any reason to worry about which bank your personal cash is held with.

2) Government-backed bonds are generally safe, but still carry risk

Despite the fact that everybody in the industry knows that long-dated bonds carry plenty of interest rate risk if you are forced to sell them before the maturity date, problems still arose here. After the Great Recession of 2008-2009, banks were encouraged to park deposits in safe securities like treasury bonds and government-backed MBS - securities that were considered safe and got you high marks during stress tests. SVB seems to have taken that to heart, in the sense that they bought lower risk stuff, but they ignored the fact that their liabilities were mostly short-term in nature and thus could very well be in position to be forced to sell them early at a loss.

The problem here was simply mismanagement - or the lack of risk management. Matching short-term deposits (VC and tech companies need to rely on short-term cash reserves much more than larger, mature, profitable businesses) with 10, 20, or even 30 year debt makes absolutely no sense. The blow could have been muted had they hedged the interest rate risk (somehow they didn’t) - or rebalanced their bond portfolio after it was clear the Fed was not slowing down the rate hikes. The fact that the yield curve was inverted during most of this period is even more shocking - as it means they were getting paid less in return for holding the riskier, longer dated bonds.

3) Contrary to the political narrative, this is definitely a bank bailout

The government announcement over the weekend was quick to highlight that any losses incurred by backstopping 100% of bank deposits at the failed institutions will be covered by the insurance fund and not the taxpayer. While true, this ignores the other part of the rescue plan. For banks that remain operational, but hold underwater positions in the same types of long dated bonds that tripped up SVB, the Fed will lend against that collateral at 100 cents on the dollar. This will minimize future bank failures by letting banks realize full value for an investment that is currently marked well below par value. Of course, this is a bank bailout using taxpayer funds (via the Fed). It may very well make a profit for the government - a la TARP - assuming they charge interest on these collateralized loans, but make no mistake - this is not private capital creating a solution but rather than Fed using its power as lender of last resort.

Much like 15 years ago, when the Fed accepted bad assets as collateral when nobody else would, SVB and Signature were the first to fail (a la Lehman and Bear) and in response those who lasted longer will reap the benefits (the other regional banks today are like Goldman and Morgan back then). So yes, it’s accurate to say the management and shareholders of failures like SVB will not get a government bailout, but their competitors will by being allowed to access newly created government-backed financial resources to keep them afloat.

4) It is likely that the Fed’s rate hiking cycle has indeed “broken something” in the economy.

But it’s not what we might have thought (the job market or GDP growth) but rather the balance sheets of the banking sector. After having been told they should hold more “good assets” like treasuries, the banks now require financial support to prevent these very securities from rendering them insolvent - even if sound risk management would have prevented problems. If this means the Fed hiking cycle will quickly come to an end, we might avoid an even bigger economic shock down the road, which could be the preferred alternative. If they keep raising rates now that banks have enhanced financial backing, well, then we’ll need to watch out for what else they will break.

Starbucks Buyback Plan Highlights Why Opportunistic Corporate Buying Is Rare

There are a lot of mixed feelings about corporate stock buybacks depending on which group of stakeholders one polls, but one thing is clear; finding instances when management teams choose to buy mostly when their stocks are temporarily and unfairly depressed is a difficult task. When times are good (and share prices reflect this sentiment), buybacks seem like an easy capital allocation decision for ever-optimistic CEOs and CFOs. When the tide turns cash is conserved and debt repayment takes precedent even as the stock price tanks to attractive levels.

Coffee giant Starbucks (SBUX) is the latest example. With union pressure coming at them in full force, the company suspended buybacks in early April so they could improve operations and employee morale without taking a political hit from returning more cash to shareholders. This week they announced they will resume buybacks in about a year, after their turnaround plan is largely completed. You can probably guess what happened to the stock price during the last five months:

See that wonderful chance for the company to retire shares in the 70’s while sentiment about their relations with employees was at its absolute worst? Yeah, sorry everyone, buybacks were suspended. Yikes.

So if we can’t rely on management to repurchase shares at the best prices, should we swear off the notion that buybacks are shareholder-friendly? A lot of people take that view, but I don’t think it’s entirely fair. Buybacks remain a way to return capital to investors in a tax-efficient manner. Dividend payments force investors to sell a portion of their investment and often results in a tax liability. If you own stock it is safe to assume you want to keep it so forcing a partial sale every three months is not ideal. If you want to sell some, you can do so on your own, and in today’s world for zero commission.

As an investor, it is probably best to think of stock buybacks as equivalent to a tax-free dividend reinvestment program. Your capital stays invested and taxes are avoided, which leaves you and you alone to determine the timing and magnitude of any position trimming. The dividend analogy also rings true because just as dividend payments are executed every quarter no matter the price of the stock, so too are most buyback programs (unfortunately).

All in all, buybacks are probably here to stay even with the new 1% federal tax that begins next year. While I prefer them to dividends (for growth companies especially), it is still pretty annoying when companies don’t match their buyback patterns with the underlying stock price volatility. When a cash cow business like Starbucks adopts the same shortcomings, it’s a good reminder that they are the rule more than the exception.

Full Disclosure: Long shares of SBUX at the time of writing but positions may change at any time

No Wonder $350B of Small Business Aid Dried Up So Fast: Public Companies Are Getting Huge Loans

Initially it seemed like a great step forward when Congress approved $350B of small business aid through the paycheck protection program (PPP). Use the funds for employee wages, rent, utilities, etc and the loan is forgiven. For small businesses, it seemed like one of the few times the federal government puts the little guy first. Well, so much for that.

We are now getting reports that publicly traded restaurant chains are getting PPP loans. Shake Shack (SHAK) and Potbelly (PBPB) got $10M each. Ruth’s Chris (RUTH) got $20M. No wonder the money ran out so fast, leaving actual “small” business owners out to dry.

Sure, large restaurant chains will use the money for wages and rent, but that’s not the point. It is about giving the money to businesses who actually need it to survive. Shake Shack just announced that after tapping their credit line, they have $112M in the bank as of April 16th. On top of that they plan to sell additional shares of stock to raise up to $75M. As if $177M would not be enough to keep them going (the company estimates they are burning through $1.4M per week, so they would have more than 2 years of cash on hand post-equity offering), let’s give them another $10M of taxpayer funds.

How many mom and pop restaurants could split that $10M? At $50,000 each, that’s 200 restaurants that are likely close to bankruptcy. Unless Congress approves more money and literally approves every loan application that is legitimately submitted, the idea that public companies can drain a small business aid package is a disgrace.

Are Stock Buybacks Really A Big Problem?

I read a recent article in the Wall Street Journal entitled The Real Problem with Stock Buybacks (WSJ paywall)  which spent a lot of time discussing multiple pitfalls of stock buybacks and touched on some lawmakers in Washington who would like to limit, or completely outlaw, the practice. To say I was dumbstruck by the piece would almost be an understatement.

Let me go through some of the article's points.

First, the idea that the SEC should have the ability to limit corporate buybacks, if in its judgment, carrying them out would hurt workers or is not in the long-term best interest of the company.

To be fair, the authors disagreed with this idea. They were simply bringing to readers' attention that it was out there. Public companies are owned by shareholders, and those shareholders are represented by the board of directors (whom they vote for). The CEO serves the board on behalf of those shareholders, though admittedly this is a problem when the CEO is also Chairman. As such, the government really has no place to tell boards how to allocate profits from the business that belong to the shareholders. This should be obvious, but evidently it is not to some. The entire activist investor concept is based on the idea that too few times investors pressure boards to act more strongly on their behalf. The system works, and should stay as-is.

The authors, however, do make an assertion of their own that I fail to understand. They claim that the real problem with stock buybacks is that they transfer wealth from shareholders to executives. More specifically, they state:

"Researchers have shown that executives opportunistically use repurchases to shrink the share count and thereby trigger earnings-per-share-based bonuses. Executives also use buybacks to create temporary additional demand for shares, nudging up the short-term stock price as executives unload equity. Finally, managers who know the stock is cheap use open-market repurchases to secretly buy back shares, boosting the value of their long-term equity. Although continuing public shareholders also profit from this indirect insider trading, selling public shareholders lose by a greater amount, reducing investor returns in aggregate."

This paragraph makes no sense, and of course, the authors (a couple of Harvard professors unlikely to have much real world financial market experience) offer up zero data or evidence to support their claims.

So let's address their claims one sentence at a time:

"Researchers have shown that executives opportunistically use repurchases to shrink the share count and thereby trigger earnings-per-share-based bonuses."

This statement implies that a shrinking share count and earnings per share growth are bad, or at least suboptimal. Why? The reason executive bonuses are based, in many cases, on earnings per share, is because company boards are working for the shareholders, and those shareholders want to see their stock prices rise over time. Since earnings per share are the single most important factor in establishing market prices for public stock, it is entirely rational to reward executives when they grow earnings.

"Executives also use buybacks to create temporary additional demand for shares, nudging up the short-term stock price as executives unload equity."

Insiders are notorious for owning very little of their own company's stock. Aside from founder/CEO situations, most CEOs own less than 1% of their company's stock. In fact, many boards are now requiring executives to own more company stock, in order to align their interests with the other shareholders even more. As such, the idea that executives unload stock at alarming rates, and that such actions form the bulk of their compensation, is not close to the truth in aggregate.

In addition, if the stock price is being supported, in part, by stock buybacks, does that not help all investors equally? Just as insiders can sell shares at these supposed elevated prices, can't every other shareholder do the same? At that case, how are the executives benefiting more than other shareholders?

"Finally, managers who know the stock is cheap use open-market repurchases to secretly buy back shares, boosting the value of their long-term equity."

This one makes no sense. Insiders buyback stock when it's cheap?! Oh no, what a calamity! In reality, company's have a poor record of buying back stock when it is cheap and often overpay for shares. Every investor in the world would be ecstatic if managers bought back stock only when it was cheap.

And how are buybacks a secret? Boards disclose buyback authorizations in advance and every quarter the company will announce how many shares they bought and at what price. It is true that such data is between 2 and 14 weeks delayed before it is published, but that hardly matters.

Again, the authors imply that increasing the value of stock is bad for investors, unless those investors are company insiders. In those cases they are getting away with something nefarious. In reality, each shareholder benefits from stock buybacks in proportion to their ownership level (i.e. equally).

"Although continuing public shareholders also profit from this indirect insider trading, selling public shareholders lose by a greater amount, reducing investor returns in aggregate."

Huh? Buying back cheap stock reduces investor returns and hurts public shareholders? I can only assume that the authors simply do not understand as well as they should what exactly buybacks accomplish and what good capital allocation looks like. It is a shame that the Wall Street Journal would publish an opinion so clearly misguided.

Trump Stock Market Rally Staring Down Formidable Opponent: Valuation

With the U.S. stock market having rallied 5% since Election Day, many investors are very enthusiastic about President-Elect Trump’s clear agenda of filling his Cabinet with wealthy business people who will be tasked with creating an optimal business environment for American companies. Slashing regulations, cutting corporate tax rates, and incentivizing profits earned overseas to be repatriated back to the U.S. will certainly put a jolt into Corporate America. Perhaps even more crucial to the recent stock market rally is the fact that infrastructure spending and corporate tax cuts are likely to be funded with additional borrowings by the federal government. As a result, we have seen a steep increase in interest rates over the last month, which has led many traders to sell bonds and reallocate that capital into stocks.

But after that asset reallocation is over, then what? Count me as skeptical that this market rally will continue for the next four years. I see two main headwinds that are likely to creep into the picture beginning in 2017; lofty legislative expectations for the Republican-controlled Congress and elevated stock market valuations.

First, there is likely to be a gap between what legislation is actually passed in 2017 and the “best-case scenario” that stocks seem to be banking on today. Dreams of a $1 trillion infrastructure spending program coupled with large personal tax cuts, as well as a reduction in the corporate tax rate from 35% all the way down to 15%, will cost a lot of money. As in trillions of dollars. Where does this money come from?

President Obama has been able to reduce the federal government’s annual budget deficit by more than 50% since he took office, but the U.S. is still spending more than half a trillion dollars more each year than it is bringing in from taxes. There are likely many Republicans who are concerned enough about our country’s finances that they would be unwilling to vote for a material increase in the budget deficit. In that scenario, $1 trillion of spend on infrastructure spending does not work. Corporate tax rates fall to 20-25% instead of 15%, and large personal tax cuts become quite small (remember George W Bush’s $300 per person tax cut in 2001?). A more subdued legislative result would limit the rush of cash into personal and corporate pockets that many are hoping for. Simply put, expectations might be too high.

Even more concerning for the stock market are current valuations. Right now the S&P 500 index trades for roughly 20.5 times estimated earnings for calendar year 2016. The average trailing 12 month price-earnings multiple over the last 50 years is 16 times. Market bulls are quick to point out that interest rates are sitting at below average levels, so stocks deserve to trade at above-average prices. That may be true, but interest rates are on the rise and over the last five years, as interest rates reached record low levels, the S&P 500 index traded between 15 and 20 times trailing earnings. As interest rates rise, stock valuation multiples should go down, not up.

This chart shows year-end price-earnings ratios for the S&P 500 index going back more than 50 years. To smooth out the downward volatility seen during recessions, I used “peak earnings” (highest ever recorded) as opposed to “current earnings” (t…

This chart shows year-end price-earnings ratios for the S&P 500 index going back more than 50 years. To smooth out the downward volatility seen during recessions, I used “peak earnings” (highest ever recorded) as opposed to “current earnings” (trailing 12 months). The consensus for 2016 earnings is to get within ~3% of the profit peak, which was in 2014 before oil’s big drop.

Simply put, price-earnings ratios are likely to trend downward over the next few years. In order for stock prices to continue their march higher, corporate profits would really need to grow quickly. If legislative action on that front disappoints in 2017, the current market optimism could very well die down quickly. Normally, Trump’s election could very well have marked the beginning of a prolonged bull market in stocks, due to his desire to put business leaders in powerful positions (the underlying assumption being that these folks will be more friendly to business than any other constituency). The big headwind to that theory this time around is that during President Obama’s two terms in office, the Dow Jones Industrial Average has soared from below 8,000 to over 19,000. As a result, the old adage that “trees don’t grow to the sky” seems particularly relevant, no matter the legislative agenda.

That is not to say that markets are going to reverse course and move dramatically lower. I think a more likely outcome is that P/E ratios move from 20-21x to 16-18x and corporate profits grow at a 5-10% annual clip. In that scenario (7.5% annual profit growth and a 17x P/E), the S&P 500 index in four years would be trading around 2,475, or roughly 10% above current levels. Not a terrible outcome, but hardly robust either.

2016 Election: Thoughts The Day After

It is reasonable to expect that the financial markets will see an increase in volatility over the coming months as folks try to decipher exactly how a Trump presidency will look, feel, and sound. I thought I would share some initial thoughts, both on the election result and how U.S. policy might evolve in 2017.

*The conventional wisdom as people digest the election results is likely to be that Trump had a unique ability to connect with a set of voters that might not have been regular voters in past cycles and were sick and tired of the political status quo (high turnout), whereas Clinton had a last name and a resume that defined that very persona (low turnout). I doubt it will get much airtime, but it turns out that only one of those scenarios played out. Below is a summary of the popular vote totals from the last four elections. I think it is quite striking and explains the result this year.

*From a business and financial market perspective, there are several issues that are likely to be addressed in 2017 now that Republicans will control the executive and legislative branches of government. They have both positive and negative aspects, which means that the exact details will be very important. Several come immediately to mind:

  • Overseas cash repatriation

  • Corporate tax reductions

  • Personal income tax reductions

  • Infrastructure spending

*In every case, the core question will be how/if the tax cuts/spending increases are paid for

*If not, more borrowing will increase the deficit and debt, which would exacerbate an existing problem

*If they are paid for, it will be important to see which segment of the country takes the brunt of the cuts. We have seen in the past that cutting services for the working class to pay for lower taxes for the wealthy and corporations doesn't work so well, so the ideal scenario would be relatively equal benefits for everyone

*Bringing foreign cash back to the U.S. should be a no-brainer no matter your political affiliation. There is no doubt that it benefits the wealthy more than others, but it makes no sense for trillions of dollars to be idling in foreign bank accounts in perpetuity

*Lower corporate taxes would definitely boost the stock market and it would be a very rational response. Again, the key is how they would be paid for (if at all) and whether cuts elsewhere would offset the benefits. Again, wealthier people have more assets invested in the markets, but higher stock prices help the value of retirement accounts no matter the size

*Starting in 2017 it should be abundantly clear what the priorities of the new administration are and how they will approach legislating them. Only then will we have a sense for whether economic optimism is warranted or not.

U.S. Unemployment Rate Drops To Historical Average in January

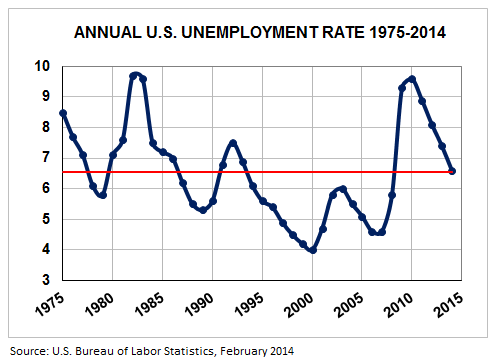
Since the political party in power will always try to spin economic data postively, while the opposing party tries to convince you the country is still in the doldrums, sometimes it's nice to put metrics like the U.S. unemployment rate in perspective by showing historical data without political interference. Accordingly, below is a chart of the unemployment rate over the last 40 years. As you can see we are back down to "average" today (the 40-year mean is the red line), so things are neither great nor terrible. That's surely not what you'll hear as the mid-term elections get into full swing this year, but that's yet another reason why politics and investment strategies shouldn't be mixed. Investing is far more dependent on reality than politics. 40Year-US-UE-Rate-1975-2014

Part Time Workers, Consumer Spending, And The Affordable Care Act

Don't worry, no political arguments will be made here. That is not worth the effort for the author or the readers of this blog. However, since we are focused on stock picking as investors, it is a valuable exercise to dig into the data and determine if there will be a material impact on U.S. corporate profits because of the Affordable Care Act. After all, if consumers' pockets are squeezed from fewer hours worked each week and/or the need to start buying health insurance for the first time, that would definitely impact the sales and earnings of the companies we are invested in. And that could hurt our portfolios.

Since the September jobs report came out this week I decided to take a look and see if the trend than many people fear as a result of the new healthcare law -- employers shifting full-time workers to part-time status in order to be exempt from being required to provide them with health insurance -- has actually started to take hold. Many people have already argued one way or the other, but most of them have political motivations and rely on a small subset of anecdotal reporting without actually looking at the numbers and reporting the truth.

The good news for our investment portfolio is that this trend has yet to materialize. It certainly could in the future, so we should continue to monitor the situation, but so far so good. Last month there were 27, 335,000 part-time workers, out of a total employed pool of 144,303,000. That comes out to 18.6% of all employed people working part-time (defined as less than 35 hours per week). That compares with 26,893,000 part-time employees during the same month last year, which equated to 19.1% of the 142,974,000 employed persons. Interestingly, part-time workers are actually going down in both absolute terms and relative to full-time workers. These numbers will fluctuate month-to-month, but it clearly has not happened as of yet.

The other potential problem with the Affordable Care Act, and more specifically the requirement that everyone buy health insurance, is that discretionary consumer spending could fall as more of one's after-tax income goes towards insurance and is not spent on discretionary items. We should remember of course that consumer spending counts the same in the GDP calculation regardless of whether or not we buy insurance or other things, so there is no overall economic impact. But, we should expect to see consumers allocate their funds differently, which could impact specific areas of the economy (vacationing, for instance).

But just how much of an impact will this have? Will it be large enough to materially hurt the earnings of many public companies? To gauge the overall potential for that we need to dig into more numbers.

About 15% of the U.S. population does not have health insurance. Let's assume 100% compliance with the Affordable Care Act (either via the purchase of insurance or the payment of the penalty for not doing so). Let's further assume that the net negative financial impact of such compliance comes to 5% of one's income (not an unfair assumption based on insurance premiums). That means that approximately 0.75% of consumer spending (5% x 15%) would be reallocated to healthcare and away from other areas. While that is not a big shift, it would be real.

However, the analysis can't end there. We can't simply conclude that approximately 1% of non-healthcare consumer spending will be lost due to the new law. Why not? Because that would assume that every American earns the same income. In reality, those impacted by the Affordable Care Act (the uninsured), are skewed towards lower and middle income folks. Most wealthier people get health insurance through their full-time jobs and will continue to do so.

Now, the bottom 50% of Americans only make 15% of the income earned nationwide. If we factor that point into the equation, then the overall impact on consumer spending goes from quite small (0.75% per year) to fairly immaterial. In fact, it comes out to something around 0.2% of overall consumer spending per year if we assume that the average uninsured person falls into the 25th percentile of total income.

So what is my conclusion from all of this? Well, I own a lot of shares in consumer-related companies both personally and for my clients, and I am not concerned about the Affordable Care Act taking a meaningful bite out of the profits that those companies are going to generate in the future.

CBO Projects U.S. Budget Problem Solved For Now

It's amazing what some tax hikes coupled with spending cuts can do for a $1.1 trillion annual budget deficit (just kidding... actually, it's pretty logical). The Congressional Budget Office (CBO), the leading group of nonpartisan budget number-crunchers, now projects that the U.S. federal budget deficit will shrink by an astounding 41% this year, from $1.087 trillion to $642 billion. The reason? Tax receipts are rising faster than expected. Couple that with budget cuts and the result is a huge dent in the annual funding gap for the federal government.

Even more important than a one-year annual decline is the trend CBO sees for the next decade. Here is a chart of their annual deficit projections through 2023:

deficitsbillions.png

As you can see, the deficit hits bottom in 2015, so this (falling deficits) is not a one-time 2013 event. Now, you may look at the rest of that chart and conclude that the good times will be short-lived, as the deficit climbs back to about $900 billion by 2022. If you are just looking at the absolute numbers alone, that would be concerning. However, we need to remember that the deficit as a percentage of GDP is what matters. Somebody making a $1 million a year, for instance, can afford a $10,000 per month mortgage payment. Somebody making $50,000 a year cannot. The ability to carry debt and service it adequately depends on how much money you have to work with, making the absolute numbers meaningless without context.

So what do the above numbers look like if we look at the deficit as a percentage of annual U.S. GDP? Here is that chart:

deficitspctgdp.png

The key number here is the last bar, which shows that the average deficit over the last 40 years (1973-2012) has been 3.1% of GDP. All of the sudden those later years don't look so scary, even though from 2015 to 2022 the deficit nearly doubles on percentage terms.

Now, it is certainly true that if we do nothing to adjust the long-term Social Security or Medicare payments we are scheduled to make, then the deficit will become a huge problem again down the road. However, it is very important to understand from an investing perspective (and possibly from a political one as well), that over the next decade we really will not have a debt problem as long as current law remains in effect and the CBO's baseline assumptions about the economy are close to accurate. Although plenty of people hated the tax hikes and/or the budget cuts that took effect this year, they are doing wonders for our debt problem. Personally, I'll take longer term gains with shorter term pains anytime, if the alternative is the exact opposite.

Would Going Over The Fiscal Cliff Really Be That Bad?

Easily the most frustrating thing about being a long-term investor nowadays is how short-term focused Wall Street has become in recent years (or more accurately, the last two decades). Quarterly earnings reports and whether companies slightly beat or slightly miss estimates made by a bunch of number-crunchers in New York result in huge share price volatility. Owners of real businesses would be the first to tell you that small quarter-to-quarterly fluctuations in sales and profits are far less important than the long-term strength, viability, and competitive position of their companies.

Political leaders have the same problem; they are obsessed with the short term because they are up for reelection so frequently. If you listen to the media, or your elected representatives, you would think going over the fiscal cliff would be absolute catastrophe. But is that actually true? Well, it depends on whether you care about the short term or long term outlook for the finances of the United States.

The Congressional Budget Office (CBO), the non-partisan fiscal accountant for Congress, projects that the U.S. would fall into a mild recession if we went over the fiscal cliff, and that the unemployment rate would rise from 8% to 9% in 2013 as a result. In 2014, the economy would return to growth, much like we have today. That is the short-term impact. And yes, that is a bad outcome for politicians currently holding office.

But what about the long-term view? Are there any positive effects that might make it worth it to have a short, mild economic downturn in 2013? This is a question the media and politicians rarely speak about. For instance, did you know that without any actions to blunt the impact of going over the fiscal cliff, the U.S. budget deficit ($1.1 trillion in fiscal year 2012) would fall 43% from 2012 to 2013. In 2014 it would fall another 40%. In 2015 it would fall another 45% (all figures are current CBO estimates). At that point, the U.S. federal budget would essentially be balanced. The deficit problem would vanish within three years, and that is if we do absolutely nothing! Congress could actually accomplish something important by not passing a single piece of legislation!

One could easily argue that the best long-term outcome for the U.S. economy would be to have a balanced budget within three years, even if it meant taking some short-term pain in 2013 as tax rates reset to Bill Clinton-era levels. But nobody is taking a longer term view. Everyone is acting as if they are on Wall Street and care only about the immediate future. There is absolutely no chance that our country's leaders do nothing and balance the budget, even though they would all agree that $1 trillion annual deficits are unsustainable and are easily the biggest problem the U.S. faces in the intermediate term.

Instead, we should expect that politicians will opt to extend most of the Bush tax cuts and postpone or eliminate most of the planned spending cuts. Such a plan would do nothing to reduce our deficits and sets us up for much bigger problems a few years down the road. What people don't seem to understand is that the debt crisis that will arise from $1 trillion annual deficits year after year is many times worse than the relatively mild 2013 recession that inaction on the fiscal cliff would cause. Don't believe that? Just ask Greece or Spain, where unemployment rates are over 25%.