RIP: Gold

I find it pretty amazing that 2021 did not turn out to be “the year of the gold bug.” You know the long-standing argument for the precious metal; huge deficit spending by the government leads to surging inflation, which in turn leads to a tremendous performance for gold - cementing its place as the dominant inflation hedge. Well, the consumer price index is setting up to exceed +6% for the year, the highest inflation rate in several decades. So let’s pop the champagne for the gold bugs as their bet finally paid off in spades:

Oh. Nevermind, I guess. Couldn’t even muster a gain of any kind this year.

The nail in the coffin for that strategy, I suppose. Hopefully that moment came a long time ago for many people.

The inflation hedge argument never really made sense to me. Over my lifetime, gold has compounded at about 4% annually versus the CPI at about 3%. Store of value? Sure. A hedge against inflation? Not so much, given that its track record is roughly the same as, well, most everything. It would be like saying U.S. small caps are a good hedge against U.S. large caps (the former narrowly outperforms the latter, on average, over the long term). Not a very compelling argument.

So why hasn’t gold done well this year? Others probably have more insight into that than I do, as I neither own gold personally nor in client portfolios. But I will say that I don’t really think demand for gold has anything to do with inflation. The supply of gold is fairly stable and predictable and the same can be said for demand (fairly narrow uses that don’t shift much year to year).

As we have seen in 2021, inflation really boils down to “too much money chasing too few goods.” In other words, strong demand coupled with constrained supply. You seem to need both to be true for prices to materially move above trend. Budget deficit hawks have been predicting inflation for a couple decades now, as government spending has surged this millennium, but price increases actually decelerated (globalism has only eased any potential supply constraints, such that strong demand has been met adequately).

Only with the pandemic and its impact on supply (of materials and labor alike) have prices surged. So within the commodities market, those raw materials that have seen the bigger supply disruption, and that are simultaneously used in the manufacturing of more “stuff,” have seen the biggest price increases. If anything, those are the inflation hedges.

While I suspect the inflation hedge argument will lose steam coming out of 2021, it will remain a part of portfolios for many managers going forward. Despite a down year, the long-term track record still suggests gold is a store of value. It also continues to have a low correlation with other asset classes, if not strong absolute performance, and that will be useful for investors looking to hedge a diversified portfolio over short periods of time. Over the long term, however, allocations to gold are likely to continue to be a drag on overall portfolio performance.

Reader Mailbag: Merits of Shorting Tesla

Reader Question:

I am curious of your take on the benefits of shorting tiny amounts of TSLA at these levels (~$850). At +800B valuation there isn't almost any room to grow reasonably. The reward of shorting might not be very big, but neither appears to be the risk.

Many skilled short sellers often give the advice that shorting based solely on valuation is unwise. I suspect the reason is that while fundamentals do matter over the long term, in the near term, investor sentiment dictates stock movements more. The stock price action of Tesla over the last year shows this clear as day.

Accordingly, if you are early and nothing fundamentally negative occurs at TSLA for the next 6-12 months, then there is nothing stopping the stock from continuing to rise. While there are lots of positives that have already played out (S&P 500 addition, fortifying their balance sheet, etc), the list of negative catalysts is harder to pinpoint. It might be more of a lack of further positive news, which could halt the momentum, as opposed to negative news.

I think TSLA is a unique business situation, much like AMZN, in the sense that their founder and CEO is not going to constrain the company to just making cars and solar panels (just as Mr. Bezos didn’t stop at books and music). As long as that is the “story” bullish investors have at their disposal, you can almost justify any valuation, including the current near-$1 trillion level. And that is the potential problem with shorting it due to overvaluation. The bulls are not buying it because the valuation looks fair; they are buying it because they believe Elon will change the world, much like Amazon has.

Along those lines, the many comparisons of TSLA’s market cap with every other auto maker in the world (combined) are easily tossed aside as irrelevant. The same notion turned out to be right when comparing Amazon to Wal-Mart a decade ago. But what if every car company transforms their fleets to EVs over the next 20 years, won’t TSLA just be another car company? Perhaps, but what if they provide the batteries and software for the majority of the industry at that point? How much is that worth? I have no clue.

I am not trying to make the case that TSLA is a buy at current levels. I do find the valuation extreme for a manufacturing company. From 2012 through 2019 the stock fetched a year-end trailing price-to-sales ratio of anywhere between 2.5x and 9.0x. At year-end 2020 that metric was over 25x. Industrial businesses don’t earn profit margins high enough to justify that kind of valuation, but the bulls will tell me TSLA is really a software play and eventually will have the largest network of self-driving EVs on the planet. Do I have a strong conviction that they are all crazy? Not really. Amazon turned out to be a computer services company as much as a retailer, and might be adding logistics management and advertising to that list too.

I simply don’t know how we value that possibility with TSLA. Shorting Amazon on valuation has never worked in 25 years. While I am confident that Ford and GM won’t be software companies eventually, I can’t say the same for TSLA. Given this narrative and reality, it is hard to place a fair value price for the stock, and therefore, hard to know when to short and when to be long.

In your question, you state that there “isn’t almost any room to grow reasonably” from current levels. Given the above narrative, I am less confident. Can we really say with conviction that TSLA can’t double their market cap by 2028 (a 10% annual CAGR from here)? I can’t, just as I can’t say with conviction that the business is worth 5x or 10x sales instead of 25x. To your point, though, if you short a tiny amount, there is not a ton of risk. in doing so. I completely agree.

Is it going to be hard for TSLA to grow enough to justify the current valuation? Absolutely. Could the stock easily be $500 a year from now, making a short position today pay off nicely? Absolutely. But I think the more interesting question is “of all the stocks out there to be long or short, does shorting TSLA rise to make the top 10 or 20 highest conviction ideas you have with which to build a portfolio?” If so, then there is your answer. If not, then I would say why not take a pass and, as Mr. Buffett would say, put it in the too hard pile?

Another part of your question got me thinking. You wrote that “the rewards of shorting aren’t very big.” Given the unlimited loss potential of shorting stocks in general, it seems that a large potential gain could be considered a prerequisite for shorting anything, TSLA included. Something to think about, as I suspect some will agree and others won’t.

All in all, I think TSLA is emblematic of the current bull market in the tech space; one where future growth potential is valued highly and current valuations and corporate profits are not. As a contrarian, value-oriented investor, I am disheartened by that development (and I don’t think it will end well for many speculators), but we also don’t know if/when the tides will shift and by how much. Given that, I tend to think that taking a lot of pitches in the batter’s box is a fair approach, especially when there are so many easier investment options out there to take a swing at.

That said, if the equity market breaks down at some point this year, it is reasonable to think the momentum plays could lead on the downside, in which case TSLA could easily fall hundreds of dollars per share. There are arguments on both sides, for sure, so then it just comes down to how much conviction you have to ultimately decide it is worth betting on one of those potential outcomes with Tesla, versus other securities.

With New Market Darling Tesla Surging, Is Its Stock The Next Amazon?

Before today’s pullback, shares of Tesla (TSLA) had more than doubled since the beginning of the year as bears capitulate and admit their bet that the company was on shaky ground financially appears to have been wrong. The company has always had cult-like followers who planned to hold the stock forever, but now with shorts scrambling to cover and momentum traders seeing a near-term opportunity, the stock touched $968.99 yesterday after fetching around $400 a month ago. Profit taking today has the shares in the mid 700’s, which equates to a market cap of roughly $140 billion.

While the last few days feel like an unsustainable bubble, one can make a bullish longer term argument based on wild growth assumptions over the next decade. Even at current prices, TSLA trades for about 5 times projected 2020 revenue, which is not out of line with its history (2.5-4.5x trailing revenue in recent years). The biggest question is not whether 5x sales is crazy, but rather if it is warranted for a manufacturing business. After all, TSLA’s 2019 gross profit margin was just 17% and the overall trend in that metric is hardly positive:

TSLA_margins-2016-2019.png

Prior to Amazon (AMZN), it would have been easy to dismiss the investment merits of a $140 billion market value company that posted a net loss of $862 million in 2019, but Bezos and Company have changed the dynamic for growth stock investors. Now anybody who can imagine large amounts of profits being generated by a business a decade or two into the future can make a bullish argument and justify nearly any stock valuation today.

The narrative that Amazon has lost money during most of its life is a bit of an overstatement (they posted losses in the first 6 years post-IPO and in the subsequent 17 years have earned profits every year except for 2), but the Tesla investment story is the same; they are changing the world and current profits are meaningless. In the 10 years TSLA has been a public company, they have lost money every year.

If Elon Musk does succeed in becoming the number #1 global car maker eventually, and other businesses develop over time to diversify into something other than a low margin manufacturing company, then the Amazon comparison is likely reasonable. With that in mind, I was curious what kind of numbers Amazon was posting when it was Tesla’s current size, and how Wall Street was valuing the stock at the time. This can tell us whether $140 billion for Tesla today is on par with what is likely the most successful business started in the last 30 years. Interestingly, the financial paths are not dissimilar:

In 2009, Amazon posted revenue of $24.5 billion, gross margins of 22.6%, and grew revenue to $34.2 billion in 2010, with similar gross margins.

In 2019, Tesla reported revenue of $24.5 billion and gross margins of 16.6%. The current consensus estimate for 2020 revenue is $32.2 billion.

There are two core differences, however. First, Amazon had racked up 7 straight profitable years by 2009, earning a $900 million profit that year, whereas Tesla lost $862 million last year on the same revenue base. Second, Amazon’s equity market value entering 2010 was $60 billion, less than half of Tesla’s current market value. Add in the fact that Amazon has moved into high margin businesses since (like AWS and advertising), which has allowed them to nearly double gross margins to 41% by 2019, and it seems that Tesla’s stock is far ahead of an Amazon-like trajectory.

So while Tesla might very well be the next Amazon, the current market price is far more exuberant than Amazon’s was a decade ago. That won’t necessarily stop TSLA stock from rising over the long term, but it does imply that its gains over the next decade are unlikely to approach those of Amazon during the prior one.

Possible Catalysts for Bottom in GE: Equity Raise and Getting Booted from the Dow

Saying that shares of one-time market bellwether General Electric (GE) have fallen upon hard times lately is surely an understatement. To see a member of the 30-component Dow Jones Industrial Average get cut in half in a year hardly ever happens, but that is exactly what has happened after the company fired its CEO, cut its dividend by half and projected that their long-time goal of earning $2 per share in 2018 was out of reach (profits this year will likely be around half that level): 

ge-1year.png

The big question now is whether GE is a screaming buy and a contrarian value investor's dream. Normally it would not be overly difficult to answer this question, but the company's financial services unit shares little information with investors, making it essentially a black box. Aggressive accounting metrics, having been carried over all the way back from the Jack Welch era, make it hard for investors to feel comfortable with the business outlook, as reported "earnings" more often than not differ wildly from actual GAAP cash flow.

That said, at $14 per share (and a dividend yield above 3% after the recent cut) the stock could very well be forming a bottom. Two announcements could very bring out nearly most every possible remaining seller; removal from the Dow and an equity raise to sure up their balance sheet.

The former seems like a forgone conclusion, though the timing is unknowable. As a price-weighted index, GE already represents the small of the 30 components by far. The next lowest priced stock in the Dow is Pfizer, which fetches more than double GE's share price. Other components such as Boeing, Goldman Sachs, and 3M are anywhere from 15 times to 24 times more heavily weighted in the index even when GE's market value is roughly the same as 3M and higher than Goldman. It is hard to imagine GE staying in the Dow for another 12 months, and when a change is made, plenty of index fund selling will occur.

Although less certain, there is a decent chance GE seeks to shore up its balance sheet by issuing more common shares in order to reduce debt. Dilutive transactions like that typically are priced below the market price of the stock at the time, and folks like Warren Buffett would likely be interested in scooping up some GE stock 5-10% below market prices. Such a move could also signal to the market that most of the bad news that could occur is behind the company.

Of course, the stock may very well be low enough that even these announcements would barely move the stock down at all, but that too would indicate that the selling has mostly passed.

All of that said, I have yet to start buying GE shares aggressively, mainly because I cannot yet get comfortable with the accounting games they play. The company has said that 2018 earnings should be the trough and that roughly $1 of earnings per share is a very conservative forecast for the year. If I felt strongly that $1 was "trough earnings" I would have little problem paying 14-15x given how many headwinds the company is facing right now. But the big question is what $1 of earnings really means to GE management.

As the company seeks to shore up its balance sheet and sell off some smaller divisions, we may get more clarity about their financial condition. Getting booted from the Dow would unleash some of the last remaining sellers (passive index funds) and raising equity could be the first step in stabilizing the capital surprises. While GE is not the ideal contrarian investment, the situation is worth watching closely as sentiment has turned severely negative and a few last shows could be getting ready to drop soon. 

With Boeing Trading For 28x Earnings, Is The Bull Market In A Melt-Up Phase?

I do not spend a lot of time on cyclical stocks and the industrials and materials sectors are not well represented in portfolios I manage. Lack of expertise is one reason, but another tricky part of investing in cyclical companies is that you need to have a decent sense of their business cycles and that is not easy unless you have some specific experience in the industry.

That said, sometimes I dabble when I can get comfortable enough with the company and stock price simultaneously. In early 2016 that combination was staring me in the face after a sell-off in Boeing (BA) prompted me to buy at prices as low as $105 per share. I do not even recall what the particular short-term Wall Street worry was at the time regarding Boeing's prospects, but if you are going to feel good about the competitive positioning of a large U.S. manufacturer, BA has got to be near the top of the list (nearly impenetrable market share, minimal competition, and fairly predictable product demand).

In 2015 Boeing had posted GAAP EPS of $7.44 per share, up modestly from 2014 and a new company record. At $105 each, the beaten down stock in early 2016 was trading at a trailing P/E of 14x and had posted free cash flow in excess of GAAP earnings for four straight years. It was a classic situation of getting a great business for a very reasonable price.

Boeing shares snapped back quickly, reaching $135 in less than two months. Earnings for 2016 were estimated to rise modestly again, which put the stock at 18x current year earnings, or nearly a market multiple for a cyclical business that was on pace for a fourth consecutive year of record earnings per share. As a result, I rang the register and was pleased with a 20% gain in a very short period of time (the IRR on the trade was over 1,000%).

Today, nearly two years later, Boeing stock closed at $320 per share:        

BA-jan2018.png

What on earth is going on here?

Company management projects GAAP EPS of $11.30 for 2017 (fourth quarter results are due out later this month), which would be 48% above 2016's record level. Boeing is trading for 28x trailing earnings, versus the S&P 500 at 22x.

Since when do cyclical stocks earning peak margins trade at premiums to the overall market? Isn't it usually the other way around? Don't investors in cyclicals typically pay high multiples on depressed earnings and lower multiples well into the upswing of a business cycle?

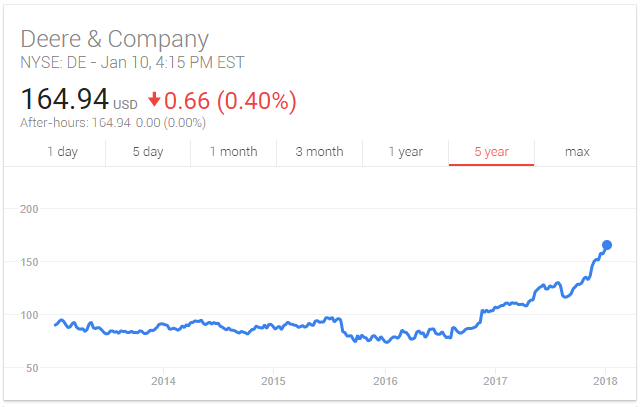
Other cyclical companies have seen steep share price climbs lately as well:

CAT-jan2018.png
DE-jan2018.png

This bull market is producing some oddities no doubt. Not too many people would believe that nearly a decade into this economic expansion Boeing would fetch a higher valuation than Google (based on 2018 earnings estimates - CB 1/12/18), but that is exactly the case today. What does it mean? It is hard to say.

Maybe investors truly believe we are in the early innings of the economic cycle and Boeing's earnings are set to soar more than they already have. Maybe the computer algorithms have taken over and just bid up every momentum-driven stock, regardless of what history would tell you about investing in cyclical companies. Maybe we are entering a melt-up/bubble phase and this market will ultimately hit a P/E ratio of 25 or 30x, with the biggest companies benefiting most due to huge index fund inflows. Maybe putting on a long Google/short Boeing paired trade today will look brilliant five years from now.

Thoughts on Boeing's valuation? Please share.

Full Disclosure: No position in Boeing at the time of writing, but positions may change at any time

Chesapeake and SandRidge Alum Tom Ward Just Admitted How Bad The Energy Exploration Business Model Really Is

Those of you who follow the energy exploration and production industry probably know Tom Ward very well. He co-founded Chesapeake Energy with the late Aubrey McClendon in 1989 and later left to start SandRidge Energy in 2006. With Chesapeake struggling mightily these days (there were whispers of a bankruptcy filing earlier this year and shares trade below $4, down from an all-time high of $74 back in 2008) and SandRidge having filed bankruptcy just this month (Ward was fired as CEO in 2013), Ward's two companies are wonderful examples of how the need to grow via debt financing can cripple energy exploration firms. Undeterred, Ward founded Tapstone Energy in 2013 as act number three.  Tapstone's web site reads "Tapstone Energy: A Tom Ward Company." I'm sorry, but given Ward's track record that's quite humorous.

I just saw Tom on CNBC discussing the current state of the domestic energy market and one of his comments was very instructive for energy investors. He said the industry's "dirty little secret is that you cannot spend within cash flow and grow production."  This comment was following his assertion that lack of access to capital was the real hindrance to the industry right now because banks "want you to spend within cash flow."

I guess banks only want to lend money to energy companies that can operate at free cash flow break-even at a minimum. This is very logical of course, as it means that the profits from the oil and gas sold can cover the interest payments due to the banks. I find it amusing that Ward is in a way criticizing the banks for being so strict so as to want to ensure they can be repaid.

But the "dirty little secret" comment is most important in my view. What Ward is saying is that energy exploration companies cannot grow their production without borrowing money to do so. Put another way, this means that drilling for oil and gas does not generate any free cash flow (after all, if it did there would be excess cash to drill more wells and thus grow production). In financial speak, maintenance capex (the amount of reinvestment requires to maintain a steady level of output) eats up every dollar of operating profit.

This is crucial for investors because stock values reflect the present value of future free cash flow. If free cash flow is never above zero, there is no profit left for equity holders after creditors are repaid. From a strictly textbook definition, that would mean that all of the common stocks are worth zero.

I wish I had heard this comment many years ago, as it might have allowed me to realize a lot sooner just how bad of a business model most independent energy producers are employing. What is amazing is how many people continue to want to invest aggressively in the sector.

Oil Slump Shines Light on Weakness of Fracking Business Model

It remains to be seen if the U.S. is in the midst of a popping bubble in shale oil and gas exploration, or if a temporarily supply glut will merely be a bump in the road, but the last couple of years have served to shine a light on what should be alarming for those who continue to be bullish on the equities of fracking companies.

The biggest crack in the long fracking investment thesis has to be the amazing lack of free cash flow generated by these companies. When oil prices were hovering around $100 per barrel investors were content with capital expenditures that far exceeded operating cash flow in the name of "growth." Leading frackers like Continental Resources (CLR), Pioneer Natural Resources (PXD), and Range Resources (RRC), among others, borrowed billions of dollars in order to continue acquiring land and drilling for oil and gas. As long as in-ground reserves increased, investors did not worry much about negative free cash flow or the lack of material dividend payments or debt repayment. They simply valued the companies based on the value of their millions of barrel of reserves.

Such events are not that surprising during a boom, but the strangest thing is what happened after oil prices cratered. At current prices, the fracking companies are rushing to slash operating costs and focus only on their lowest cost wells in order to bring cash operating costs per barrel down as low as possible. Doing so allows them to continue to service their debt and wait for commodity prices to turn around (at least for those companies with above-average acreage and manageable leverage).

What I find so disturbing is what has happened to the cash flow statements of these fracking companies during this transition away from rapid growth and towards operational efficiency; most of them are only able to operate at free cash flow breakeven, at best. The economics of fracking are so poor that even when you are supremely focused on minimizing operating costs and extracting from only your most productive wells, you still cannot generate free cash flow. And yet, these circumstances are exactly when you would expect profits to be highest (again, your best wells operating at the lowest possible cost). Simply put, the economics of fracking for low-cost producers should be very strong right now, but they are not.

What does this say about the fracking business model? Why should investors be putting their money into these stocks?  If you care at all about the quality the businesses you invest in, and you judge quality at least to some degree by how profitable the model is, this energy cycle should be very illuminating. If the best companies in the industry cannot generate material free cash flow today, then when?

The pipeline stocks look better and better to me every day.

Full Disclosure: No positions in CLR, PXD, and RRC at the time of writing, but positions may change at any time

The Oil Shale Revolution Is A Double-Edged Sword

Back in the old days falling energy prices were a clear incremental tailwind for the U.S. economy. Some economists even went as far as to argue that low gasoline prices were the equivalent of a tax cut for consumers, but that line of thinking never made sense to me. After all, a tax cut implies that you have more money in your pocket, but when gas prices go down you have the same amount of money. You are simply able to reallocate some of it away from gas and into other things, as your total spending stayed the same.

Then the shale revolution came to the U.S. and technological advances resulted in states like Colorado, Ohio, Pennsylvania, and North Dakota having large slices of their regional economies linked to oil production. The tide shifted and the U.S. economy now was tied to oil production as opposed to simply consuming oil imports from Canada and the Mideast. When oil prices were high that was a good thing, but now that oil has cratered from $100 per barrel to below $30 we can clearly see the other side of the double-edged sword.

To understand why the stock market is reacting so much lately to falling oil prices, we simply have to think about the ripple effects now that we have so many more domestic oil producers. Most of these shale firms are relatively new companies that borrowed billions of dollars to acquire land and start drilling. Their business models were predicated, in most cases, on oil prices of $75-$100 per barrel. Once prices dropped below $50 certain companies no longer could produce oil profitably. As prices have continued to fall, more and more companies fall into that category. Very, very few can make money sub-$30 per barrel.

So what happens in this scenario? Frankly, many smaller oil companies will not survive. Without profits they will not be able to pay the interest on their debt (let alone the principal), which causes multiple problems. Most importantly for investors and financial markets, as debts go unpaid lenders will lose a lot of money. The energy sector owes tens of billions to banks and investors who hold their corporate bonds. Much of that debt is held in mutual and exchange traded funds, so the losses will accrue from the biggest banks all the way down to small investors. And without knowing how low oil prices will fall, and for how long it will stay there, there is no way to know exactly how many companies will survive and how much debt will go into default. That uncertainty is impacting financial markets today, this month especially.

The other issue worth mentioning is why exactly oil prices have not been able to stabilize after so many months of decline. The problem of excess supply is not self-correcting as quickly as many might have thought (the cycle looks like this: high prices result in too much drilling, prices fall due to oversupply, production is curtailed due to unprofitable prices, supply comes down to balance the market, low prices spur demand, prices stabilize and rebound).

For these shale companies want to hang on as long as they can, they simply need to keep paying the interest on their debt. If their debt does not come due for another 2-3 years, the companies can continue to sell oil at prices above their cost, so long as they have a little runway left on their bank credit lines and they can generate enough cash to cover interest payments. The reason we have not seen many oil-related bankruptcies yet is simply because very little of the debt has come due. But that time will come, and as long as oil prices remain low the banks and other lenders will not shell out any more money. Only then will companies stop producing, which will start to bring the supply/demand picture back into balance.

Coming back the stock market specifically, it is important to note that the non-energy sector is doing just fine (S&P 500 companies actually grew earnings in 2015 if you exclude the energy sector). Lenders will take some losses on their energy loans, but the size of that market is small relative to the rest of the economy. For that reason, it is fair to say that the current stock market correction is sector-specific and not indicative of a widespread, systemic problem (unlike in 2008 when banks were in danger of closing, this time they will simply take losses on a part of their loan book).

For comparison purposes, today's situation reminds me very much of the dot-com bubble that peaked in early 2000. As was the case with oil in recent years, back then there was a bubble in one sector of the domestic economy (tech and telecommunications). While it caused a recession in the U.S. the problem was contained to that one area, which allowed for a relatively swift recovery. In fact, S&P 500 corporate profits peaked in 2000 at $56 before falling by 30% to $39 in 2001. Earnings began to rebound in 2002, got back to even in 2003, and hit a new all-time record of $67 in 2004.

The goods news is that this time around things should turn out considerably better because the energy sector peaked at 15% of the S&P 500 index in 2014, whereas the tech and telecom sectors comprised 30% of the S&P 500 in 1999. Therefore, energy should have only about half of the impact compared with the technology sector 15 years ago. Even as oil prices collapsed in 2015, S&P 500 profits only fell by 6% from their peak. While that number could certainly get a bit worse if oil stays at current prices for the duration of 2016, there is a floor in sight; in terms of market value the energy sector today only represents 6% of the S&P 500.

Contrarian Opportunity of the Moment: Oil Stocks

You may remember back in 2008 there was a debate about whether financial market participants ("speculators") and the billions of dollars they moved around every day were impacting prices to such an extent that it severely widened the gap between what was "real" in the world and what the markets were supposedly telling us. Efficient market believers want us to think that the market always reflects reality and things rarely get off track. As we saw in 2008, however, market prices often did not accurately gauge the underlying fundamentals of the financial industry. Many companies were in trouble, no doubt, but when pretty much every single asset is mis-priced at the same time, there are clearly instances where the short-term traders have overcome the system regardless of what the underlying fundamentals truly are.

I am not saying that today's oil market is anywhere near as mispriced today, but when the price of a barrel of oil fetches $100 in late July and then in December drops to $58, when very little in the world has changed during the interim, investors need to ask themselves if the daily ebb and flow of the capital markets, and the computers that largely control that flow these days, is materially impacting the price action we are seeing in the oil market.

Is the U.S. energy production boom helping contribute to a temporary glut of oil? Yes. Has the supply-demand picture shifted so much that $58 oil reflects the true balance between supply and demand in the end markets for crude oil? I suspect probably not. Now, if $100 per barrel was the "wrong" price based on supply and demand then you can certainly argue that prices should have come down quite a bit. But when prices drop so quickly and then the fall accelerates lately as it has, I have to think financial "speculators" and short-term hedge fund traders are controlling the near-term price quotes.

CRUDE OIL PRICES HAVE DROPPED BY 43% IN LESS THAN 6 MONTHS

If you think we will look back a year or two from now and think $58 oil was a bargain, as I do, then now is the time to think about increasing exposure to the sector. Below are some of the names I like along with their current quotes (long all except EOG as of this writing).

Mega-cap integrated dividend payer: BP PLC (BP) $36

Large cap E&P growth: EOG Resources (EOG) $86

Small cap E&P growth: Halcon Resources (HK) $1.95

Pipeline infrastructure: Enlink Midstream (ENLC/ENLK) $29/$25

Gold: It's Just Yellow Metal

Henry Blodget said it perfectly in an article published on Thursday ("Gold Prices Collapse As Everyone Remembers It's Just Yellow Metal"). Now that the financial crisis is over and the U.S. economy is normalizing (albeit slowly), gold is no longer an asset class that makes much sense to many who have loved it in the recent past. Gold has no inherent intrinsic value, so buyers are merely hoping that others will buy it from them at a later date for more than they initially paid. There is no claim on any assets, which could increase in value over time (unlike a share of stock which represents a piece of ownership in a money-making corporation). Some people say gold is a currency, and yet you cannot deposit it into your checking account or use it to buy goods at your local store.

In fact, the recent strength in the U.S. stock market, coupled with severe weakness in gold prices, has resulted in stocks now having beaten gold since 2009. It took some time, but fundamentals do matter again. See the chart below:

gld-vs-spx.png