Snowflake: Don't Let The Insane Stock-Based Compensation Fool You

The stark contrast between tech stock valuations in 2022 vs 2021 has been a welcomed development for those of us in the camp that is quite sensitive to earnings multiples when making investment decisions. As share prices across the sector started to collapse I was eager to step in for long-term holding periods even though I knew the bottom would likely be below my initial entry point. Now that the shakeout has occurred, there are many bargains, but not everything is cheap.

I was struck by an interview on CNBC yesterday with Brad Gerstner, who runs a tech-focused hedge fund called Altimeter Capital. Brad has been super bullish on Snowflake (SNOW) since the IPO given the company’s strong competitive position in a fast growing market. What I found odd was that as the market shifted away from the idea that almost any price can be paid for the best growth, Altimeter didn’t shift its positioning. SNOW was the fund’s largest holding when it reached $400 in 2021 and traded for 100 times sales and it remains so today with the shares at $150 (a meager 28 times sales).

During the same interview Gerstner made the compelling argument that in a highly inflationary economic climate with rising interest rates the market will not reward companies that seek growth over profitability any longer. Oddly, he then turned right around and pounded the table on SNOW because the valuation has compressed so much (from insane, to just extremely rich, I might add).

He repeatedly pointed to SNOW’s free cash flow growth, which he expects to double from $350 million in 2022 to $700 million in 2023. That would seem to imply that SNOW is indeed one of the tech firms that has pivoted from growth to profitability and thus may deserve a high sales multiple due to high profit margins. The problem is that SNOW’s income statement is littered with red ink. Take a look at their financial results from the first three quarters of 2022:

No, you are not misreading that income statement. So far this year SNOW’s revenue has grown by more than 75% and its net loss increased. Pre-tax profit margins are negative 41%.

So how on earth is SNOW reporting positive free cash flow, to the tune of hundreds of millions annually, when in reality it is bleeding red ink on the books? Well, they have learned that the key to getting their large investors to buy into crazy valuations is to generate cash even when you have accounting losses. And the only way to do that is to pay the vast majority of your compensation in stock and not cash.

Here is SNOW’s stock-based comp figure for the first 9 months of 2022:

$633 million! That equates to 40% of total operating expenses! No wonder it’s so easy for a large investor in your company to go on television and rave about your free cash flow generation. You are excluding 40% of your expenses from the equation!

Now, let me be clear. Snowflake’s market position is very strong; nobody is refuting that. This funding strategy says nothing about the company, other than how it is doling out shares and then ignoring that fact when it discussed profitability. The company is not profitable today, which makes a near-30x sales multiple look silly.

That said, they will make money at some point. With gross margins rising and approaching 70% right now, the business could easily earn 20% net margins in the future once they get their cost base in-line with other more mature software firms. Those future margins could command a valuation above the market overall (a 30x P/E with 20% margins implies a 6x sales multiple).

Bur the reality today is that the company is growing without any regard to expenses and the only way it is worth this price is if everything goes wonderfully for the next 5-10 years. Many believe that will happen. Gerstner claimed in his interview that SNOW will grow free cash flow 50% annually for many years and that the valuation will stay where it is today - for a total stock return of 50% annually over the same period. Neither of those seem like reasonable hurdles to clear in my eyes, but we’ll have to see how it plays out.

Bottom line: don’t get fooled into thinking that in tech land “free cash flow = profitability.” Normally it does, but not when you use stock-based compensation to a degree never seen in prior economic cycles (not even in Silicon Valley). And for investment managers who don’t hesitate to make their largest position something fetching 100 times revenue, ask yourself if that’s is what history says is a wise move financially, or if more likely that was what their investor base at the time wanted - and thus they had to figure out a way to justify doing it. Why they are still sticking to their guns is a question I can’t answer.

Now Available: Bear Market Blue Chip Bargains

One of the best things about bear markets in stocks is that investors can get pretty good prices for blue chip stocks that trade at material premiums during most of the business cycle. As the market declines we can find more and more examples. Here is one I took a screenshot of a few days ago. Cut in half year-to-date, for a company of this caliber? Wow, despite it being quite overvalued near its peak. Looking back five or ten years from now, how will it look if we put some shares away for the long haul today? Feels like an interesting add to a youngster’s college fund, for instance.

Starbucks Buyback Plan Highlights Why Opportunistic Corporate Buying Is Rare

There are a lot of mixed feelings about corporate stock buybacks depending on which group of stakeholders one polls, but one thing is clear; finding instances when management teams choose to buy mostly when their stocks are temporarily and unfairly depressed is a difficult task. When times are good (and share prices reflect this sentiment), buybacks seem like an easy capital allocation decision for ever-optimistic CEOs and CFOs. When the tide turns cash is conserved and debt repayment takes precedent even as the stock price tanks to attractive levels.

Coffee giant Starbucks (SBUX) is the latest example. With union pressure coming at them in full force, the company suspended buybacks in early April so they could improve operations and employee morale without taking a political hit from returning more cash to shareholders. This week they announced they will resume buybacks in about a year, after their turnaround plan is largely completed. You can probably guess what happened to the stock price during the last five months:

See that wonderful chance for the company to retire shares in the 70’s while sentiment about their relations with employees was at its absolute worst? Yeah, sorry everyone, buybacks were suspended. Yikes.

So if we can’t rely on management to repurchase shares at the best prices, should we swear off the notion that buybacks are shareholder-friendly? A lot of people take that view, but I don’t think it’s entirely fair. Buybacks remain a way to return capital to investors in a tax-efficient manner. Dividend payments force investors to sell a portion of their investment and often results in a tax liability. If you own stock it is safe to assume you want to keep it so forcing a partial sale every three months is not ideal. If you want to sell some, you can do so on your own, and in today’s world for zero commission.

As an investor, it is probably best to think of stock buybacks as equivalent to a tax-free dividend reinvestment program. Your capital stays invested and taxes are avoided, which leaves you and you alone to determine the timing and magnitude of any position trimming. The dividend analogy also rings true because just as dividend payments are executed every quarter no matter the price of the stock, so too are most buyback programs (unfortunately).

All in all, buybacks are probably here to stay even with the new 1% federal tax that begins next year. While I prefer them to dividends (for growth companies especially), it is still pretty annoying when companies don’t match their buyback patterns with the underlying stock price volatility. When a cash cow business like Starbucks adopts the same shortcomings, it’s a good reminder that they are the rule more than the exception.

Full Disclosure: Long shares of SBUX at the time of writing but positions may change at any time

Is It Time To Swipe Right On Match Group Stock?

A little over two years ago, IAC completed a full spin-off of its interest in dating app giant Match Group (MTCH) with the stock around $100 per share and a ~$30 billion equity value (a partial spin was consummated in 2015). As a holder of IAC at the time, I felt MTCH was priced fully and sold the MTCH shortly thereafter.

Lately though the stock has been trading extremely weakly as revenue growth slows down (Tinder and other apps are reaching a more mature state). Match’s stock chart looks more like a profitless tech stock in the current market environment, but in reality this is a really “GARPy” situation because MTCH generates prolific free cash flow and has ever since it started trading on its own in 2015.

At the current $59 price, the equity is valued at about $17 billion with annual free cash flow of $800-$900 million, which means it trades at a market discount on that metric. Given their dominant position in the dating space, this company doesn’t need to trade based on revenue growth to work very well for investors. I expect robust share buybacks and strategic M&A to aid in growing per-share cash flow and earnings for many years to come and it appears the current sell-off is letting new holders get in at a very good price if they are so inclined. Count me as part of that group.

Full Disclosure: Long shares of MTCH at the time of writing, but positions may change at any time

Unlike with GameStop, Ryan Cohen Cashes In His Chips Just In The Nick Of Time

“Why on earth would I pay an advisor when I can trade for free with Robinhood on my phone?”

- 27 year-old meme stock trader

I am asked about meme stocks and my opinion of people like Ryan Cohen all the time. Cohen was interesting because while he has amassed a fortune over the last decade (all due credit to him), each move had also resulted in him leaving a lot on the table. He hasn’t really had a Mark Cuban moment yet (Cuban sold Broadcast.com at the top for all stock and immediately hedged the Yahoo shares he received before they crashed) so his loyal cult-like following is interesting. Consider that:

Cohen sold Chewy in 2017 for $3 billion in cash, but the buyer (PetSmart) took it public in 2019 at a value of $9 billion and today it’s worth $18 billion. About $15 billion left on the table at current prices.

Cohen bought 5.8 million shares of GameStop in August of 2020 for a mere $6 apiece (pre-split). But when they skyrocketed more than 80-fold in just five months (peaking at a stunning $483 apiece) he didn’t sell or hedge a single share. About $2 billion left on the table at current prices.

His Bed Bath and Beyond common stock investment appeared on its way to the gutter. The purchase of nearly 8 million shares at ~$15 apiece during Q1 2022 had lost 2/3 of its value as of 3 weeks ago and his proclamation that the chain’s buybuy Baby unit was worth more than $15 per share by itself was proven to be totally off the mark after buyout offers came in nowhere near that price.

Perhaps Mr. Cohen has learned a lot. When his followers bid up BBBY stock to $30 from $5 in just 12 trading days this month, Cohen unloaded quickly, selling it all in just 2 days and netting a profit of nearly $70 million or 56% while his Twitter followers were claiming he wasn’t going to sell. This trade was timed perfectly, though his business valuation skills aren’t yet in the same league as other prominent activist investors.

The move reminded me of Silver Lake Partners’ stake in the convertible debt of AMC back in 2021. Cohen’s followers hate the “smart money” hedge funds and private equity funds, but Silver Lake did what they all try to do; play the hand you are dealt the best you can. Silver Lake was sitting on losing hand of underwater AMC convertible debt in a company that nearly went bankrupt during the pandemic, but the meme stock folks bailed them out. By bidding up shares of AMC, it allowed Silver Lake to convert their debt into equity and on the very same day sell every single share at a profit.

It turns out Ryan Cohen lacks “diamond hands” when it becomes obvious that is the right move. I don’t know if people will turn on Cohen after this BBBY experiment (as with GameStop, most of them will show big losses after following him blindly), but I do know that we should not be cheering amateur investors who are gambling on these stocks without understanding valuations, balance sheets, or SEC filings. It was obvious to professionals that Cohen’s amended 13D from August 16th showed no new positions in BBBY. The filing itself even said so: “This Amendment No. 2 was triggered solely due to a change in the number of outstanding Shares of the Issuer.” But most people didn’t actually read it. Instead they just relied on posts on Twitter and Reddit to get bullish and pile in. And the ensuing rally gave Cohen his selling opportunity.

Even after Cohen filed to sell his entire stake and the filing was made public on August 17th, the believers were saying he hadn’t yet sold, even though the filing itself said he expected to sell on the 16th. And what do you know? By the close of trading on the 17th he was out completely after 2 days of selling.

These are easy things for an investment advisor to understand and offer guidance on. There were other silly rumors too, being spread by novices, like the one that said since he hadn’t held his stock for 6 months every dollar of profit Cohen made would have to be returned to BBBY, which would help them repay their debt. Sure.

Look, I am not saying that everyone needs to hire an advisor and be completely hands off with their investment portfolio. But having a pro to bounce ideas off of and direct questions to can literally pay for itself in a single trade if one is inexperienced and making speculative bets without understanding what is really going on. It can be a collaborative business relationship that adds value. And over the long term, many novices will become knowledgeable enough through experience that they can rely less and less on their advisor and eventually jettison them completely if they prefer.

The investing environment today reminds me a lot of 2000-2002 when I started in this business as an advisor. People had gotten burned by the tech stock bubble and were swearing off investing completely (not completely clear if the Robinhood crowd will get to this point yet - but their trading volumes suggest probably). They sold their Invesco tech mutual fund and put what was left in bank CDs. Those kinds of moves almost never work out well, but after you’ve been burned it’s hard to venture back into the kitchen.

I am afraid that the same thing is going to happen with the new young generation of investors. First, it was about screwing over the large hedge funds and leveling the playing field for the little guy and gal. But the field is not level when we are dealing with understanding the markets. It’s fine to hate Citadel but blindly following people on Twitter and Reddit is not going to help you build wealth. If people like Ryan Cohen start acting like the same Wall Street activist hedge funds that they love to hate, it will likely turn off this new generation from the markets.

Could Corporate Profits Hold Up Better This Cycle?

If the pandemic has taught us anything I think it is that this economic cycle is unlike any others we can point to in history given the uniqueness of how the entire globe has had to react to Covid-19. The investment community tends to try and predict current trajectories with those of prior cycles, and I am no different. In fact, in my latest quarterly letter to clients I pointed out that during the last four recessions S&P companies saw profits fall between 20% and 40% peak to trough. Coupled with near-certain multiple compression, it is easy to see how and why stock prices get walloped during recessionary periods, even if the drops are relatively short-lived in the grand scheme of things.

So here is where I am going to through a wrinkle into the discussion. What if things play out a little bit different this time? I doubt we can avoid a recession at this point, given that Q1 GDP was negative (due solely to a lack of exports by the way - entirely pandemic related). Q2 GDP could easily put us into a recession. In fact, the Atlanta Fed’s real time estimate for Q2 is currently showing a negative reading, so that ship might have sailed already. So what would be different this time? Well, what if corporate profits hold up better than in recent prior cycles, which could serve to cushion the downturn in stock prices a bit and help spring a fairly quick recovery?

There are a few factors that I think could play into this thesis. First, Q1 earnings actually rose year over year despite negative GDP growth. Current forecasts call for another (small) increase for Q2 despite a possible negative GDP print. So that’s interesting. Even if second half 2022 profits fall versus 2021, it would take quite a big impact to see the typical 20-40% decline from 2021’s record profit level.

There are multiple tailwinds to earnings this cycle that have not been big factors in recent decades. Strong energy prices relative to what we would normally see in a recession? Check. High inflation that keeps revenue figures elevated as long as customers don’t balk at buying? Check. Interest rates that are rising rather than falling, which would actually help the bottom lines of many financial companies? Check. A historically tight labor market that might result in the unemployment rate rising less during this downturn that prior ones? Check. Relatively limited supply of housing units relative to demand that could limit any glut/price collapse for both owned and rented properties? Check.

Look, this is just a thesis that seems like it has a bunch of bullet points going for it. I have no idea if we actually see corporate profits only decline 10 or 15% this cycle versus 20-40% historically. But if one is feeling a tad more bullish than many headlines would indicate, there are green shoots to point to.

I also wonder if this is why the P/E for the U.S. stock market remains near historical averages for a mid-cycle climate (16-17x) rather than a recession (10-14x). If a recession comes but profits hang in there, there might not be a reason for stocks to ever trade that low. So maybe the market is expecting profits to hold up rather well, just as I am postulating. Of course, the flip side of the argument is not reassuring (i.e. if this thesis is wrong maybe another big leg down is coming).

Needless to say, I am more interested in watching profit numbers than I am GDP or CPI going forward. While I agree estimates need to come down from current levels, I want to see by how much. I think that will tell us whether the worst for the market is behind us, or if 2022-2023 is going to play out similarly to 2001/2008/2020.

For those who will be doing the same, here is where the numbers stand as of today for S&P profits:

2021 CY: $208 (all-time record, 32% above 2019’s $157)

TTM Q1: $210 (+40% yoy)

2022 Q1: $49 (+4% yoy)

2022 Q2: $55 (estimate, +5% yoy)

2022 CY: $223 (estimate, +7% yoy)

A Look At Pre-2008 Equity Market Valuations

We hear a lot of market commentators refer to long-term average P/E multiples for the U.S. stock market when trying to assess what “fair value” might be. It is interesting to me that oftentimes the time periods they choose to focus on often map right on to the desired conclusion they want to numerically support.

For instance, the trailing 10 -year average P/E for the S&P 500 index is about 19.5. As a result, bullish Wall Street strategists can easily, and usually without much pushback, come on TV and pronounce the market cheap (at current prices - 3,735 - and current 2022 profit estimates - $224 - the market P/E is about 16.7x).

Of course, over the last 10 years we have had record-low interest rates that some thought would remain forever, but we are seeing that might not be the case. As an example, over the last 11 years, the 10-year U.S. treasury bond closed below 2% a whopping 5 times. Not likely we see a similar path over the next 11 years, with the 10-year pushing 3.5% today.

So if our goal should be matching historical data with current economic conditions, my attention turns to the period of 2002-2007, an 5-year run where the 10-year bond largely traded between 4 and 5 percent. What was the average market P/E ratio during that time? About 17 times. Using 2022 S&P profit estimates we arrive at a fair value of 3,800 - a mere 2% above current levels.

As we all know, in the near-term valuations overshoot to the downside and in recessions profits can take a quick one-year tumble. That dual uncertainty tells us that stocks could certainly go materially below that level for a few quarters without surprise. But over the intermediate to long term, even if higher interest rates persist, the overvaluation situation seems to have already largely corrected itself, as it always does.

The biggest question for me is where earnings go from here. Near term? Anyone’s guess. Longer term? History tells us not to bet against U.S. companies and their ability to grow profits over the economic cycle. Consider this: in the last 60 years the S&P 500 index has seen its cumulative earnings drop in back-to-back years just 4 times. As a result, investors who take a multi-year view rarely do poorly provided they don’t severely overpay for equities.

I know rates are most in focus right now, but I think the key to the next 12-24 months in the market will be how S&P earnings hold up relative to the all-time record $208 posted in 2021.

It's Official: Tech Bubble 2.0 Has Burst

Economic bubbles are inevitable, much like the business cycle, but history shows they oftentimes don’t repeat in exactly the same way. For instance, I don’t think it’s likely we see another real estate bubble inflated by interest-only, pick-your-payment, or no-doc income loans, but there are other ways for property values to go bonkers. I would have said the same thing about the late 1990’s dot-com bubble, and I would have been wrong.

Those of us who remember that time period recall that profitless companies with little more than a lackluster business model saw share prices surge just by issuing an “internet-related” press release. We were told the market opportunity was so big that the current iteration of the product or service didn’t matter, let alone the valuation of the company. Businesses with real revenue were losing money but since the market opportunity was so large, we could try and justify paying 20 times sales instead of 20 times earnings. The big cap stocks back then played out a little differently, with stocks like Cisco and JDS Uniphase fetching more than 100 times earnings (compared with 25-40 times for Apple, Microsoft, and Google this cycle).

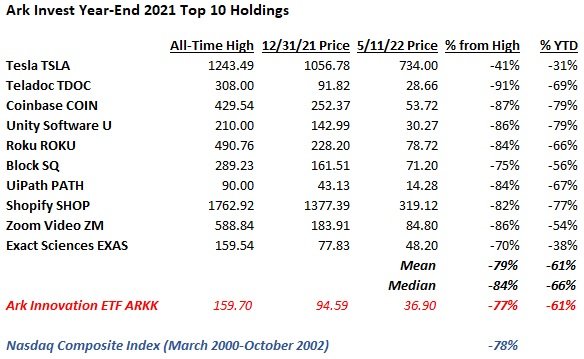
The rise and subsequent fall of Ark Invest’s flagship Innovation ETF (ARKK), special purpose acquisition companies (SPACs) targeting story stocks with a path to revenue five years out, and another general IPO boom (why is Allbirds public?) have largely mirrored the environment from 20+ years ago. We have fancy new terms (large market opportunity replaced with “TAM,” dot-com replaced with “innovation”) but the end result was nearly identical; profitless companies trading for insane valuations based on a dream of every good story becoming the next Amazon.

Exactly how close have we come to those olden days? Well, from the March 2000 peak (5,132) to the bottom in October 2002 (1,108), the Nasdaq Composite index fell by 78%. Take a look at the average decline for Ark Invest’s top 10 holdings (as of year-end 2021) from their peak:

Talk about deja vu.

Will the Nasdaq fall 78% again this time around? I doubt it because the biggest constituents today include many of the aforementioned names that are richly valued but never got to bubble territory. They alone should prop up the index in relative terms. As of today the Nasdaq is down 30% from the November 2021 peak. I think it’s more likely than not that the index doesn’t even get to minus 50% because of the mega caps.

Regardless, should we be worried? Well, no doubt the short term pain has been brutal. Although I didn’t chase the “innovation” highfliers shown above, I have been adding to my tech exposure as prices drop and have lots of red ink to show for it now. But I think the longer term outlook is pretty darn good for the highest quality businesses.

Why? Well, we are starting to see certain companies begin to acknowledge that the bubble is over and pivot towards cutting back on hiring and overall spending in order to turn operating losses into profits. They realize that showing revenue growth is not going to work for Wall Street anymore so margins have likely troughed for this cycle. The Uber CEO was recently very explicit that this is the route they are now taking and while the stock hasn’t reacted yet, I think they will prove to be a long-term winner and quite profitable over the intermediate term.

Not every company will go this route right away and they will find it hard to raise more money to keep the cycle going. They missed the chance to raise $5 billion at a $50 billion valuation - 10% dilution looks paltry now - and they will get an earful if they try to raise the same amount with a $10 billion valuation. But give it 6 or 12 months and I think most will come around to the idea that even innovative companies need to breakeven or make a little money.

I also expect the new environment will accelerate M&A activity. Bigger firms can bulk up and take out one of the many new competitors (do we really need so many SAAS companies or EV manufacturers?) and the cost synergies that come with a deal will also accelerate the margin expansion that investors now crave. I would not have guessed that Twitter would be the first big deal to get announced (and it’s a bit of a unique circumstance), but more deals should follow after everyone catches their breadth and the public markets stabilize a bit.

As for how I am approaching the current environment, I am fairly unconcerned if shares move against me right away (I’m not going to catch the bottom - I just want my cost basis to look solid 2-3 years from now). Many stock prices will look silly in the near-term if you believe they will emerge as leaders (Uber at half the IPO price despite the company having doubled revenue since then and having committed now to moving towards profitability?) but I am focused on trying to buy the winners cheaply regardless of what the next 3-6 months bring.

The current market reminds me of the Warren Buffett line that he wouldn’t care if the market closed for a few years. If you see a company you like for the long-term and the valuation finally looks compelling, I can’t help but suggest that maybe you buy it and put it away for 3-5 years rather than try and make sense of the near-term outlook and/or dynamics.

Full Disclosure: Long UBER at the time of writing but positions may change at any time

Yes, The Pandemic Accelerated Netflix's Path To Maturity

With shares of Netflix (NFLX) down 36% today to around $220 after reporting a net subscriber decline (ex-Russia service winddown it was a small net increase) and forecasting another decline for Q2, it makes sense to try and assess where the company is and where it might be going.

The most obvious explanation for subscriber gains being halted is the impact of the pandemic and how it pulled forward years of demand. It boils down to a simple question; if you didn’t sign up for Netflix in 2020 or 2021, will you ever? The answer would seem to be “no” anecdotally, and the numbers are now showing this to be the case. Surprising? No. Fully priced into the stock before today? Clearly not.

Here is a chart from the Wall Street Journal showing the subscriber trend:

I added the gold trend line myself to highlight that if you look at the multi-year period, you can see the subscriber trend is pretty consistent from start to finish, even though the demand pull-forward (the bars above the line starting during 2020-2021) was quite material. So NFLX subs are about where they would have been anyway, but the path was more lumpy and unpredictable, which has made for a dreadful stock performance:

We are back to 2018 levels…

The company earned about $11 per share in 2021 (and that is a GAAP number if you can believe it - good for them for not “adjusting” anything). So here we sit at 20x earnings, in-line with the S&P 500. So should we be bullish or bearish from here?

I think it solely comes down to whether you think the company is in a strong competitive position or not. If you believe that they have a loyal customer base and will be able to leverage the largest global streaming audience of any service, then the risk/reward looks quite attractive.

In that case, they should have pricing power into the future, be able to reasonably monetize the ~100 million households who don’t pay (they share passwords with the 220 million households who do), leverage their massive audience by introducing new offerings as time goes on, and make changes to their video service to respond to what others like Disney and HBO have done (e.g. release hit content week to week rather than all at once, add an advertising-supported tier for cost-conscious viewers and/or those who are password sharing).

My personal view is that the above factors are compelling in terms of stacking the deck in their favor now that they have reached the point where most everyone (at least in the developed markets) who wants to watch their stuff is watching.

But there is certainly a counter-argument, so let’s explore it. The bears will say that Apple, Amazon, and Disney can outspend them because they have highly-profitable business segments outside of streaming. So while Netflix was the first mover, that advantage is gone and their business has peaked. Over time, they would argue, Netflix will actually lose subscribers, rather than slowly climb towards the 300 million the bulls have always assumed was a matter of when, not if. If true, then there is no pricing power and content spend will increase more than revenue, which would be a big problem for the business, profitability, and the stock price.

Perhaps it’s too early to tell how loyal viewers are to Netflix. The success of a password-sharing monetization strategy will tell us a lot about that because if those 100 million viewers leave rather than pay a few bucks to keep watching, then Netflix probably isn’t a top tier streaming service. And if it’s not then growing earnings from the current $11 per share (and thus the stock price) will prove a difficult task.

I think they have a lot of levers to pull, but acknowledge that they need to do so thoughtfully and gently. Lastly, this is not a near-term turnaround story. Management doesn’t seem to have a full grasp on every issue they are facing coming out of the pandemic when running the business will get harder. So they will test things and evolve over time, as they have thus far. Still, at a $100 billion market cap, for the first time in a long while, the bar isn’t being set very high.

Full Disclosure: I bought some Netflix stock today at $230 per share

Why Market Timing Is Near Impossible

Ever since the meme stock revolution began on Reddit in early 2020 I have seen the same trends that everyone else has; younger investors, new to the scene, trying to day-trade their way to wealth. I would echo the same sentiments as many professionals, namely that having young people engage with the investing community is great, so long as they embark on a strategy for their money that sets them up for success based on what we know works (and doesn’t) from decades of experience.

Early in my career I thought that a modest amount of market timing made sense. After all, when you read that over the history of the S&P 500 index, there is a direct inverse correlation between the performance of stocks in each quintile of valuation (as judged by P/E ratio), or that the index itself does far better when starting from a lower P/E, you can really only conclude that having more cash when the market P/E is high and none when it is low would boost returns.

Personal experience, however, shows that it is more complicated than that. The reason is that the strategy works over, say, 40 or 50 years, but it is less reliable over 5 or 10 years. The problem lies in the fact that you don’t know which specific periods will overperform or underperform (only the end result), and if you miss out on returns due to high cash levels for an extended period, it will seemingly take forever to get back above water.

For instance, let’s say that my investment strategy was to be 25% in cash anytime the market was trading for a P/E ratio of 20x or more. Well, I would have had a ton of cash over the last five years (earning close to zero) while the market nearly doubled. If I am supposed to make all of that money back by going to 0% cash whenever the P/E ratio falls below 15x (in this hypothetical barbell strategy maybe I have 5-10% cash between 15x and 20x), I really need the market to go down soon, but what if the P/E stays above 15x for another 10 years?

Playing the “long-term averages” only works when you can be certain that you will be in the game during the highs and the lows and everything in between. If you start investing at 20 years old and stick to the strategy until you are 70 then it will probably work just as the data suggests. But if you are like the majority of people and are only use the strategy for 10-20 years, it is far less likely to work and requires quite a bit of luck (i.e. through no skill of your own you need to hit the right period where the long-term trend follows perfectly).

Okay, Chad, but what if you mix in some economic observation and forecasting into the strategy? For instance, maybe you can time the shifts in overall portfolio cash position to overall economic conditions. Try to predict when recessions are more likely, for example. Or just reduce cash during recessions to ensure you are fully invested when prices are low. It’s easier said than done.

Let’s assume for a moment that you, unlike most everyone else on the planet, have an uncanny ability to forecast when S&P 500 company profits are going to decline within the economic cycle. You surmise that the market should go down when profits are falling so you will use this knowledge to simply lose less money during market downturns than the average investor.

The long-term data would support this strategy. Since 1960, the S&P 500 index has posted a calendar year decline 12 times (about 19% of the time). Similarly, S&P 500 company profits have posted calendar year declines 13 times during that period (21% of the time). This matches up with the often repeated statistic that the market goes up four years out of every five (and thus you should always be invested). But what if you can predict that 5th year? Surely that would work.

Here’s the kicker; while the S&P 500 index fell in value during 12 of those years and corporate profits fell during 13 of those years, there were only 4 times when they both fell during the same year. So, on average, even if you knew for a fact which years would see earnings declines, the stock market still rose 70% of the time.

So the stock market goes up 80% of the time in general and in years when corporate profits are falling the it goes up 70% of the time. And so I ask you (and every client who I discuss this with), how on earth can anyone expect to know when to be out of the market?

The problem with market timing seems to be that even if you have a decent track record avoiding a high stock market allocation during times of extreme froth and overvaluation, any alpha you generate will likely be completely offset during periods when you think stocks will perform poorly (and are positioned accordingly) only to see them rise instead.

It probably took me 10-15 years of investing experience to fully understand these dynamics and greatly reduce the weight I gave to the data I saw as a young investor that shaped by views for a long time. In fact, I still have a Fortune Magazine article that got me thinking that way. Here is a chart featured nearly 20 years ago:

Note: While this data focuses on individual stock returns based on P/E ratio, the results are similar if you map out the entire index’s performance against it’s aggregate P/E (since the index is just the sum total of its constituents).

Gone are the days that I try to figure out what the market is going to do. If I have a lot of investment opportunities that I like, I will have less cash onhand, and vice versa. Sometimes that will happen to overlap with overall market conditions, but sometimes it won’t and that’s fine by me nowadays.