A Look At Pre-2008 Equity Market Valuations

We hear a lot of market commentators refer to long-term average P/E multiples for the U.S. stock market when trying to assess what “fair value” might be. It is interesting to me that oftentimes the time periods they choose to focus on often map right on to the desired conclusion they want to numerically support.

For instance, the trailing 10 -year average P/E for the S&P 500 index is about 19.5. As a result, bullish Wall Street strategists can easily, and usually without much pushback, come on TV and pronounce the market cheap (at current prices - 3,735 - and current 2022 profit estimates - $224 - the market P/E is about 16.7x).

Of course, over the last 10 years we have had record-low interest rates that some thought would remain forever, but we are seeing that might not be the case. As an example, over the last 11 years, the 10-year U.S. treasury bond closed below 2% a whopping 5 times. Not likely we see a similar path over the next 11 years, with the 10-year pushing 3.5% today.

So if our goal should be matching historical data with current economic conditions, my attention turns to the period of 2002-2007, an 5-year run where the 10-year bond largely traded between 4 and 5 percent. What was the average market P/E ratio during that time? About 17 times. Using 2022 S&P profit estimates we arrive at a fair value of 3,800 - a mere 2% above current levels.

As we all know, in the near-term valuations overshoot to the downside and in recessions profits can take a quick one-year tumble. That dual uncertainty tells us that stocks could certainly go materially below that level for a few quarters without surprise. But over the intermediate to long term, even if higher interest rates persist, the overvaluation situation seems to have already largely corrected itself, as it always does.

The biggest question for me is where earnings go from here. Near term? Anyone’s guess. Longer term? History tells us not to bet against U.S. companies and their ability to grow profits over the economic cycle. Consider this: in the last 60 years the S&P 500 index has seen its cumulative earnings drop in back-to-back years just 4 times. As a result, investors who take a multi-year view rarely do poorly provided they don’t severely overpay for equities.

I know rates are most in focus right now, but I think the key to the next 12-24 months in the market will be how S&P earnings hold up relative to the all-time record $208 posted in 2021.

It's Official: Tech Bubble 2.0 Has Burst

Economic bubbles are inevitable, much like the business cycle, but history shows they oftentimes don’t repeat in exactly the same way. For instance, I don’t think it’s likely we see another real estate bubble inflated by interest-only, pick-your-payment, or no-doc income loans, but there are other ways for property values to go bonkers. I would have said the same thing about the late 1990’s dot-com bubble, and I would have been wrong.

Those of us who remember that time period recall that profitless companies with little more than a lackluster business model saw share prices surge just by issuing an “internet-related” press release. We were told the market opportunity was so big that the current iteration of the product or service didn’t matter, let alone the valuation of the company. Businesses with real revenue were losing money but since the market opportunity was so large, we could try and justify paying 20 times sales instead of 20 times earnings. The big cap stocks back then played out a little differently, with stocks like Cisco and JDS Uniphase fetching more than 100 times earnings (compared with 25-40 times for Apple, Microsoft, and Google this cycle).

The rise and subsequent fall of Ark Invest’s flagship Innovation ETF (ARKK), special purpose acquisition companies (SPACs) targeting story stocks with a path to revenue five years out, and another general IPO boom (why is Allbirds public?) have largely mirrored the environment from 20+ years ago. We have fancy new terms (large market opportunity replaced with “TAM,” dot-com replaced with “innovation”) but the end result was nearly identical; profitless companies trading for insane valuations based on a dream of every good story becoming the next Amazon.

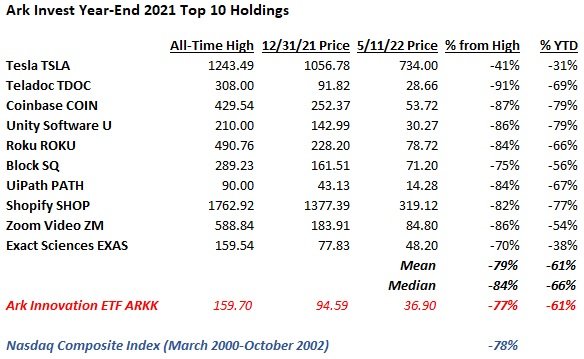
Exactly how close have we come to those olden days? Well, from the March 2000 peak (5,132) to the bottom in October 2002 (1,108), the Nasdaq Composite index fell by 78%. Take a look at the average decline for Ark Invest’s top 10 holdings (as of year-end 2021) from their peak:

Talk about deja vu.

Will the Nasdaq fall 78% again this time around? I doubt it because the biggest constituents today include many of the aforementioned names that are richly valued but never got to bubble territory. They alone should prop up the index in relative terms. As of today the Nasdaq is down 30% from the November 2021 peak. I think it’s more likely than not that the index doesn’t even get to minus 50% because of the mega caps.

Regardless, should we be worried? Well, no doubt the short term pain has been brutal. Although I didn’t chase the “innovation” highfliers shown above, I have been adding to my tech exposure as prices drop and have lots of red ink to show for it now. But I think the longer term outlook is pretty darn good for the highest quality businesses.

Why? Well, we are starting to see certain companies begin to acknowledge that the bubble is over and pivot towards cutting back on hiring and overall spending in order to turn operating losses into profits. They realize that showing revenue growth is not going to work for Wall Street anymore so margins have likely troughed for this cycle. The Uber CEO was recently very explicit that this is the route they are now taking and while the stock hasn’t reacted yet, I think they will prove to be a long-term winner and quite profitable over the intermediate term.

Not every company will go this route right away and they will find it hard to raise more money to keep the cycle going. They missed the chance to raise $5 billion at a $50 billion valuation - 10% dilution looks paltry now - and they will get an earful if they try to raise the same amount with a $10 billion valuation. But give it 6 or 12 months and I think most will come around to the idea that even innovative companies need to breakeven or make a little money.

I also expect the new environment will accelerate M&A activity. Bigger firms can bulk up and take out one of the many new competitors (do we really need so many SAAS companies or EV manufacturers?) and the cost synergies that come with a deal will also accelerate the margin expansion that investors now crave. I would not have guessed that Twitter would be the first big deal to get announced (and it’s a bit of a unique circumstance), but more deals should follow after everyone catches their breadth and the public markets stabilize a bit.

As for how I am approaching the current environment, I am fairly unconcerned if shares move against me right away (I’m not going to catch the bottom - I just want my cost basis to look solid 2-3 years from now). Many stock prices will look silly in the near-term if you believe they will emerge as leaders (Uber at half the IPO price despite the company having doubled revenue since then and having committed now to moving towards profitability?) but I am focused on trying to buy the winners cheaply regardless of what the next 3-6 months bring.

The current market reminds me of the Warren Buffett line that he wouldn’t care if the market closed for a few years. If you see a company you like for the long-term and the valuation finally looks compelling, I can’t help but suggest that maybe you buy it and put it away for 3-5 years rather than try and make sense of the near-term outlook and/or dynamics.

Full Disclosure: Long UBER at the time of writing but positions may change at any time

Yes, The Pandemic Accelerated Netflix's Path To Maturity

With shares of Netflix (NFLX) down 36% today to around $220 after reporting a net subscriber decline (ex-Russia service winddown it was a small net increase) and forecasting another decline for Q2, it makes sense to try and assess where the company is and where it might be going.

The most obvious explanation for subscriber gains being halted is the impact of the pandemic and how it pulled forward years of demand. It boils down to a simple question; if you didn’t sign up for Netflix in 2020 or 2021, will you ever? The answer would seem to be “no” anecdotally, and the numbers are now showing this to be the case. Surprising? No. Fully priced into the stock before today? Clearly not.

Here is a chart from the Wall Street Journal showing the subscriber trend:

I added the gold trend line myself to highlight that if you look at the multi-year period, you can see the subscriber trend is pretty consistent from start to finish, even though the demand pull-forward (the bars above the line starting during 2020-2021) was quite material. So NFLX subs are about where they would have been anyway, but the path was more lumpy and unpredictable, which has made for a dreadful stock performance:

We are back to 2018 levels…

The company earned about $11 per share in 2021 (and that is a GAAP number if you can believe it - good for them for not “adjusting” anything). So here we sit at 20x earnings, in-line with the S&P 500. So should we be bullish or bearish from here?

I think it solely comes down to whether you think the company is in a strong competitive position or not. If you believe that they have a loyal customer base and will be able to leverage the largest global streaming audience of any service, then the risk/reward looks quite attractive.

In that case, they should have pricing power into the future, be able to reasonably monetize the ~100 million households who don’t pay (they share passwords with the 220 million households who do), leverage their massive audience by introducing new offerings as time goes on, and make changes to their video service to respond to what others like Disney and HBO have done (e.g. release hit content week to week rather than all at once, add an advertising-supported tier for cost-conscious viewers and/or those who are password sharing).

My personal view is that the above factors are compelling in terms of stacking the deck in their favor now that they have reached the point where most everyone (at least in the developed markets) who wants to watch their stuff is watching.

But there is certainly a counter-argument, so let’s explore it. The bears will say that Apple, Amazon, and Disney can outspend them because they have highly-profitable business segments outside of streaming. So while Netflix was the first mover, that advantage is gone and their business has peaked. Over time, they would argue, Netflix will actually lose subscribers, rather than slowly climb towards the 300 million the bulls have always assumed was a matter of when, not if. If true, then there is no pricing power and content spend will increase more than revenue, which would be a big problem for the business, profitability, and the stock price.

Perhaps it’s too early to tell how loyal viewers are to Netflix. The success of a password-sharing monetization strategy will tell us a lot about that because if those 100 million viewers leave rather than pay a few bucks to keep watching, then Netflix probably isn’t a top tier streaming service. And if it’s not then growing earnings from the current $11 per share (and thus the stock price) will prove a difficult task.

I think they have a lot of levers to pull, but acknowledge that they need to do so thoughtfully and gently. Lastly, this is not a near-term turnaround story. Management doesn’t seem to have a full grasp on every issue they are facing coming out of the pandemic when running the business will get harder. So they will test things and evolve over time, as they have thus far. Still, at a $100 billion market cap, for the first time in a long while, the bar isn’t being set very high.

Full Disclosure: I bought some Netflix stock today at $230 per share

Why Market Timing Is Near Impossible

Ever since the meme stock revolution began on Reddit in early 2020 I have seen the same trends that everyone else has; younger investors, new to the scene, trying to day-trade their way to wealth. I would echo the same sentiments as many professionals, namely that having young people engage with the investing community is great, so long as they embark on a strategy for their money that sets them up for success based on what we know works (and doesn’t) from decades of experience.

Early in my career I thought that a modest amount of market timing made sense. After all, when you read that over the history of the S&P 500 index, there is a direct inverse correlation between the performance of stocks in each quintile of valuation (as judged by P/E ratio), or that the index itself does far better when starting from a lower P/E, you can really only conclude that having more cash when the market P/E is high and none when it is low would boost returns.

Personal experience, however, shows that it is more complicated than that. The reason is that the strategy works over, say, 40 or 50 years, but it is less reliable over 5 or 10 years. The problem lies in the fact that you don’t know which specific periods will overperform or underperform (only the end result), and if you miss out on returns due to high cash levels for an extended period, it will seemingly take forever to get back above water.

For instance, let’s say that my investment strategy was to be 25% in cash anytime the market was trading for a P/E ratio of 20x or more. Well, I would have had a ton of cash over the last five years (earning close to zero) while the market nearly doubled. If I am supposed to make all of that money back by going to 0% cash whenever the P/E ratio falls below 15x (in this hypothetical barbell strategy maybe I have 5-10% cash between 15x and 20x), I really need the market to go down soon, but what if the P/E stays above 15x for another 10 years?

Playing the “long-term averages” only works when you can be certain that you will be in the game during the highs and the lows and everything in between. If you start investing at 20 years old and stick to the strategy until you are 70 then it will probably work just as the data suggests. But if you are like the majority of people and are only use the strategy for 10-20 years, it is far less likely to work and requires quite a bit of luck (i.e. through no skill of your own you need to hit the right period where the long-term trend follows perfectly).

Okay, Chad, but what if you mix in some economic observation and forecasting into the strategy? For instance, maybe you can time the shifts in overall portfolio cash position to overall economic conditions. Try to predict when recessions are more likely, for example. Or just reduce cash during recessions to ensure you are fully invested when prices are low. It’s easier said than done.

Let’s assume for a moment that you, unlike most everyone else on the planet, have an uncanny ability to forecast when S&P 500 company profits are going to decline within the economic cycle. You surmise that the market should go down when profits are falling so you will use this knowledge to simply lose less money during market downturns than the average investor.

The long-term data would support this strategy. Since 1960, the S&P 500 index has posted a calendar year decline 12 times (about 19% of the time). Similarly, S&P 500 company profits have posted calendar year declines 13 times during that period (21% of the time). This matches up with the often repeated statistic that the market goes up four years out of every five (and thus you should always be invested). But what if you can predict that 5th year? Surely that would work.

Here’s the kicker; while the S&P 500 index fell in value during 12 of those years and corporate profits fell during 13 of those years, there were only 4 times when they both fell during the same year. So, on average, even if you knew for a fact which years would see earnings declines, the stock market still rose 70% of the time.

So the stock market goes up 80% of the time in general and in years when corporate profits are falling the it goes up 70% of the time. And so I ask you (and every client who I discuss this with), how on earth can anyone expect to know when to be out of the market?

The problem with market timing seems to be that even if you have a decent track record avoiding a high stock market allocation during times of extreme froth and overvaluation, any alpha you generate will likely be completely offset during periods when you think stocks will perform poorly (and are positioned accordingly) only to see them rise instead.

It probably took me 10-15 years of investing experience to fully understand these dynamics and greatly reduce the weight I gave to the data I saw as a young investor that shaped by views for a long time. In fact, I still have a Fortune Magazine article that got me thinking that way. Here is a chart featured nearly 20 years ago:

Note: While this data focuses on individual stock returns based on P/E ratio, the results are similar if you map out the entire index’s performance against it’s aggregate P/E (since the index is just the sum total of its constituents).

Gone are the days that I try to figure out what the market is going to do. If I have a lot of investment opportunities that I like, I will have less cash onhand, and vice versa. Sometimes that will happen to overlap with overall market conditions, but sometimes it won’t and that’s fine by me nowadays.

A Tech Bubble Basket To Monitor

As promised in my last post, below you will find what I am calling a “bubble basket” of tech stocks I have been taking a look at to varying degrees. The Russia/Ukraine situation is taking center stage in the markets these days, but I can’t really add much insight into the geopolitical landscape. From a stock perspective, the most I can offer is that maybe trimming energy exposure, if you have a nice chunk of it, would be an opportunistic move into the current rally. What I find far more intriguing from a long-term contrarian investing standpoint is sifting through the carnage in tech-land.

The dozen companies shown here range from small cap (Redfin and Vimeo) all the way to mega cap (Amazon and Facebook/Meta) and cumulatively have lost more than half of their value from the peak. Doesn’t mean they are all automatic buys just because of a large decline from bubbly levels, but it highlights the pain that has been sustained. Surely there are opportunities here, much like in 2000-2002.

You will notice I highlight price-to-sales ratios (PSR) instead of price-to-earnings (PE). I think it makes for a more apples-to-apples comparison when you have companies at different life stages. I am not fundamentally opposed to a growth company employing the Amazon “reinvest every dollar that comes in” approach - even if it cannot possibly work for everyone - and so if you believe in certain businesses long term regardless of current profitability, using the PSR can help you weed out the “priced to perfection” crowd (e.g. 20x sales).

Even still, the PSR is not a shortcut method. An e-commerce play has a different margin profile than a software company and thus the sales multiple should reflect that. I think the key is finding a mismatch where the multiple implies low profit margins at maturity but the business positioning could indicate otherwise. As an example, we see Uber at 2.5x sales and Chewy at 2.1x. One could argue that gap should be wider.

Anyway, I just wanted to share a list I have been working off of lately. I suspect the basket itself will do well over the next few years given the depressed prices. Picking the relative winners and losers is a trickier task, but one that might be well worth digging into.

As Bubble Tech Rightfully Corrects, What Looks Good and What Doesn't?

“This time” is never different. The last few years in techland reminded many of us of the late 1990’s bubble. Sure, not every detail is identical. Back then the mega caps traded at crazy prices too (the Cisco’s of the world at >100 times earnings) but this time 25-30x for Apple, Microsoft, Google, or Facebook might be on the rich side, but not grossly overvalued. And just as last time we had Amerindo, Van Wagoner, and Navallier, now we have seen history repeat with ARK Invest.

Just as was the case 20 years ago, there will be great buying opportunities during this valuation reset. Netflix down 50%? Interesting. Amazon down 25%? Interesting.

I will share a list of tech that doesn’t look expensive anymore in the coming weeks (think: low to mid single digit price-to-sales ratios), but first let’s consider what kinds of situations still look frothy even after big declines. 15x sales isn’t attractive just because it was 30x six months ago. Current profits (or at least a clear path to get there within 1-2 years) are important.

Let me share one example where the price still looks silly; DoorDash (DASH) at a $40B valuation. Sure, it was $90B at the peak. All that tells us is how crazy things got. On the face of it, the pandemic should have instantaneously made DASH a blue chip name in the tech space that was raking in money. Other than maybe Zoom, which “pandemic play” would you have rather owned on fundamentals alone?

However, the numbers tell a different story. I think they illustrate the problem with the current Silicon Valley mentality of favoring TAM rather than profit margins when it comes to investing in the public markets. Every management team says they are mimicking the “Amazon model” but Amazon was never hemorrhaging money. They wrote the book on running the business at breakeven and reinvesting every penny generated back into the business. There is a big difference between flushing capital down the toilet and running at breakeven to try and maximize future free cash flow.

Here is how DASH’s financials have evolved as the largest food delivery service during the best possible operating environment imaginable:

DASH lost $875 million in the 24 months immediately preceding Covid and then proceeded to lose $774 million in the first 21 months since. As an investor, why own this?

There are people who believe there is a high conviction path to this business turning those losses into a billion dollar annual profit. Possible? Sure. Essentially a done deal? Hardly. It will be difficult. And the price today, even after a near-60% stock price drop, implies a 40x multiple on that billion dollars. Yikes.

Simply put, many of these businesses will make their customers smile. The trick is to figure out how to make the income statement smile too. Amazon figured it out. Many of their followers won’t be able to.

For Real: Labor Hours Likely Stunting The Business Model at The RealReal

As an only child, much of my 2021 was spent handling the estate of a loved one who passed away unexpectedly last spring. As I went through my childhood home and organized possessions that had been accumulated by my family over 50+ years it became obvious that the best way to get the job done eventually and minimize wastefulness (by finding good new homes for most items) was to go the consignment route. With a category such as apparel and accessories, the natural fit was The RealReal (REAL), a publicly-traded full service online consignment web site.

Unlike some of their competitors, REAL does the hard work for you and takes a higher cut for their efforts. While I was not considering the shares as an investment, the experience of using the service as a consignor, which I am a few months into, was nonetheless interesting from a business analysis perspective, especially with the stock having lost about two-thirds of its value from the all-time high.

My takeaway is that the main reason why a client would hire REAL (minimize the work required to sell items) is exactly what will make this a very hard business to run efficiently and profitably. With labor costs rising and worker shortages front and center due to the pandemic, the barriers to scale are likely even more pronounced now than a couple of years ago.

Consider how many labor hours REAL employees put in to make this model work. First, a local consignment representative will come to my house, go through my items, bag them up, and take them home with them. They do this for free. I also have the option to box them up myself and ship them to a REAL distribution center via UPS, also on REAL’s dime. Given the volume I have, I opted for local pickup.

Once the employee has the items they manually photograph and inventory them before packing them up and sending them in via UPS. Upon reaching their destination, another set of employees unpacks them and sorts them to be routed to the appropriate product specialist. The experts will then inspect every item for condition and use their knowledge of the current market to price and list each item on the site. And obviously once an item sells, more labor is required to pack and ship it to the retail customer.

Oh, and don’t forget returns. While REAL requires buyers who want to return something pay the return shipping costs themselves, more labor is needed to receive the items, inspect them for damage, and restock them in the warehouse and on the site. Return rates in the apparel sector are sky high, often in the 30-50% range.

Even without rising minimum wage rates across the country and a renewed enthusiasm for remote-only work, you can see how labor intensive this business model is. And it doesn’t exactly scale well with higher volumes of items. Yikes.

Okay, but don’t they make good money off of sold goods? Sure, with gross profit running at about 60% even accounting for lower margin physical stores, of which they have some. But the expense lines are nuts. For the first nine months of 2021, SG&A, operations, and technology costs totaled 95% of revenue. Add in a another 14% of sales for marketing and the operating loss was negative 49%. Pandemic related expenses are hurting lately, but even in 2019 operating margins were still negative 32%.

It’s going to be a tall order to get this business, in its present form, to profitability. Gross profits are falling despite rising revenue and they have seen no expense leverage except on the marketing line (undoubtedly due to huge labor needs).

Before this experience, I wasn’t really paying much attention to REAL stock. Afterwards, with shares trading at about 2x 2021 revenue, I don’t see any reason to start. Maybe somebody bigger buys them at some point, but other than that, I recommend merely consigning through them if you don’t want the hassle of photographing, listing, pricing, and shipping stuff yourself.

Full Disclosure: No position in REAL at the time of writing, although positions may change at any time

RIP: Gold

I find it pretty amazing that 2021 did not turn out to be “the year of the gold bug.” You know the long-standing argument for the precious metal; huge deficit spending by the government leads to surging inflation, which in turn leads to a tremendous performance for gold - cementing its place as the dominant inflation hedge. Well, the consumer price index is setting up to exceed +6% for the year, the highest inflation rate in several decades. So let’s pop the champagne for the gold bugs as their bet finally paid off in spades:

Oh. Nevermind, I guess. Couldn’t even muster a gain of any kind this year.

The nail in the coffin for that strategy, I suppose. Hopefully that moment came a long time ago for many people.

The inflation hedge argument never really made sense to me. Over my lifetime, gold has compounded at about 4% annually versus the CPI at about 3%. Store of value? Sure. A hedge against inflation? Not so much, given that its track record is roughly the same as, well, most everything. It would be like saying U.S. small caps are a good hedge against U.S. large caps (the former narrowly outperforms the latter, on average, over the long term). Not a very compelling argument.

So why hasn’t gold done well this year? Others probably have more insight into that than I do, as I neither own gold personally nor in client portfolios. But I will say that I don’t really think demand for gold has anything to do with inflation. The supply of gold is fairly stable and predictable and the same can be said for demand (fairly narrow uses that don’t shift much year to year).

As we have seen in 2021, inflation really boils down to “too much money chasing too few goods.” In other words, strong demand coupled with constrained supply. You seem to need both to be true for prices to materially move above trend. Budget deficit hawks have been predicting inflation for a couple decades now, as government spending has surged this millennium, but price increases actually decelerated (globalism has only eased any potential supply constraints, such that strong demand has been met adequately).

Only with the pandemic and its impact on supply (of materials and labor alike) have prices surged. So within the commodities market, those raw materials that have seen the bigger supply disruption, and that are simultaneously used in the manufacturing of more “stuff,” have seen the biggest price increases. If anything, those are the inflation hedges.

While I suspect the inflation hedge argument will lose steam coming out of 2021, it will remain a part of portfolios for many managers going forward. Despite a down year, the long-term track record still suggests gold is a store of value. It also continues to have a low correlation with other asset classes, if not strong absolute performance, and that will be useful for investors looking to hedge a diversified portfolio over short periods of time. Over the long term, however, allocations to gold are likely to continue to be a drag on overall portfolio performance.

Maybe We Should Resist Panicking Over Inflation Until Mid-2022

It should never surprise us how short-sighted financial market participants and economists are, given that they all make their living by making moves or commenting on the moves of others on a daily basis. And yet, I am still disappointed that the recent talk of elevated inflation has not been met with more context. Yes, I know that the consumer price index (CPI) rose by 6.2% in October, the largest increase in decades, but why do we never hear about how that compares with 2020 or 2019?

Corporations have been quick to compare 2021 financial results with 2019, the so-called “two-year stack,” because everybody knows that 2020 was an anomaly in terms of sales and profits. Why no talk that maybe 2021 was also an anomaly in terms of inflation?

It reminds me of when people freak out every time gas prices at the pump spike temporarily. Oh my goodness, can you believe gas is $4 a gallon some places in the country? Somebody has to do something about this out of control inflation right away, they say. In reality, gasoline prices have been lagging overall inflation for decades. They should be the last item people complain about when it comes to price increases.

According to the U.S. Energy Information Administration, retail gas prices today average $3.30 per gallon. Ten years ago it was $3.31. The U.S. hit $3 for the first time right after Hurricane Katrina, more than 16 years ago. Yes, gas prices tend to be volatile and thus when you look peak to trough periodically increases will look gigantic. But if you look at the longer term data, gasoline has actually been a relative boon for consumers’ wallets.

Unsurprisingly, the same logic extends to inflation. Focusing on just the CPI figure for October 2021 ignores that for the 2 years before that, October CPI has averaged 1.5%, for a 3-year average of +3.1% (hardly something to be overly concerned about).

Given that in any single year these inflation figures, whether it be for a single item like gas or the entire basket, can be volatile, I think multi-year trends are key. It’s one thing if we get 5% inflation for a year and then it recedes. It’s entirely another if we get that level of price gains for 2-3 years straight.

So when do we start to lap what very well could be one-time pandemic-related spikes in the CPI? Not until the spring of 2022 (the CPI first hit 5% in May 2021). If we get another 5% print this coming May, okay, maybe there is something more going on here that has a long-lasting impact. But if we get a 3% print in May 2022 and 1-2% in May 2023, history will have once again played out as it usually does, with mean reversion telling a completely different story than a single isolated data point.

I suspect that is what Fed Chair Jerome Powell is thinking when he downplays the risk of longstanding inflation well above historical trends. I think it is more likely than not that we see a similar outcome this time around, though zero interest rates are probably still not the correct policy decision.

Are Financial Markets Getting Even Less Predictable in the Near Term?

Earlier in my investment management career it was not uncommon for me to raise a fair amount of cash, say 10-20%, in client accounts when I thought the equity market was overheated. The idea was that I would have plenty of firepower when prices dropped and bargains were abundant. Over the years the data suggested that such a move was rewarding, at best, half the time. Too many instances, though, resulted in prices rising enough before they fell that the cash positions at best offered no alpha.

Don’t get me wrong, I have always been in the camp that market timing in the near term is difficult (hence I would never go to 50, 75, or 100 percent cash), but I learned that mean reversion, while a real thing, could not really be consistently exploited profitably even on just a small part of a portfolio. As a result, cash balances in my managed accounts now reflect the number of interesting investing opportunities I see out there, rather than overall market levels.

As I have spoken with clients this year, I think 2021 has solidified the argument against market timing even more, if that’s possible. Profits for S&P 500 companies this year are currently on track to come in roughly 30% above 2019 levels. And that result has not happened because the pandemic suddenly waned. In fact, we are seeing a lot of data that would suggest corporate profit headwinds; retail supply constraints, a lack of qualified labor, and a chip shortage - to name a few - all of which are profit margin-negative.

Despite such strong profit growth, interest rates remain very low with the 10-year bond yield hovering below 1.5%. The end result is an S&P 500 that fetches 23 trailing earnings after surging for most of the year. Who would have been able to predict that? It seems to me even fewer people than would have done so in more normal economic times.

The current inflation story reinforces the point even more; that short-term market movements are getting even less predictable than in the past. And that’s certainly saying something. We just learned today that consumer prices rose by more than 6% in October, a 30-year high. Remember how one of the main jobs of the Federal Reserve is to raise interest rates to keep inflation subdued? Would any short-term investment strategist suggest that 6% inflation would not result in higher interest rates and thus lower stock valuations? And yet, here we sit with the Fed Funds interest rate sitting at zero. Not just an average rate. Not just a below average rate. But zero.

I didn’t come into 2021 trying to predict the economy and the markets and thank goodness for that. For those who still do try that sort of thing, I think 2021 has taught us that a very tough job is getting near impossible, if it wasn’t there already.

So what to do? Throw up our hands, of course. But in conversations with clients I find myself saying “I have no idea” more often than ever. Some may find that disappointing, especially coming from an industry professional, but if my track record predicting stock prices, interest rates, or other economic metrics six months out was unimpressive before the pandemic, imagine how subpar it would be now. I much prefer to just sit back and try to invest in undervalued companies regardless of the macro backdrop and I think my clients are best served by that as well.