Loose Merger Agreements Are Causing Corporate Clashes Among Partners

It is being reported that Sycamore Partners is trying to get out of their $525 million deal to acquire a controlling stake in Victoria’s Secret, claiming that the chain violated the agreement when they closed their stores due to the pandemic. I have not read that particular agreement, but I was curious whether there was a MAC (material adverse change) clause in Simon Property Group’s deal to buy Taubman Properties and extend their lead as the dominant shopping center REIT in the country.

The language in their merger agreement is likely similar to most that were drafted during a bull market (light on conditions that would allow the buyer to walk away). In fact, I was pretty surprised to see what events were listed specifically that would under no circumstance warrant exiting the deal. Form page 82 of the agreement:

That’s right. Why should a pandemic impact the closing of a merger between shopping mall giants? :)

That’s right. Why should a pandemic impact the closing of a merger between shopping mall giants? :)

I wonder if lawyers will leave pandemics on that list in future merger agreements or if Covid-19 really will come and go without leaving a trace longer term in the corporate world. Hopefully buyers will get smarter and protect themselves against long tail events.

Interestingly, TCO stock is currently trading around $41 per share (22% below the deal price of $52.50 in cash). As a Simon shareholder, I hope they are able to negotiate the price down but still use their vast liquidity to scoop up Taubman’s trophy assets. With the deal supposed to close around mid-year, we should find out soon enough.

No Wonder $350B of Small Business Aid Dried Up So Fast: Public Companies Are Getting Huge Loans

Initially it seemed like a great step forward when Congress approved $350B of small business aid through the paycheck protection program (PPP). Use the funds for employee wages, rent, utilities, etc and the loan is forgiven. For small businesses, it seemed like one of the few times the federal government puts the little guy first. Well, so much for that.

We are now getting reports that publicly traded restaurant chains are getting PPP loans. Shake Shack (SHAK) and Potbelly (PBPB) got $10M each. Ruth’s Chris (RUTH) got $20M. No wonder the money ran out so fast, leaving actual “small” business owners out to dry.

Sure, large restaurant chains will use the money for wages and rent, but that’s not the point. It is about giving the money to businesses who actually need it to survive. Shake Shack just announced that after tapping their credit line, they have $112M in the bank as of April 16th. On top of that they plan to sell additional shares of stock to raise up to $75M. As if $177M would not be enough to keep them going (the company estimates they are burning through $1.4M per week, so they would have more than 2 years of cash on hand post-equity offering), let’s give them another $10M of taxpayer funds.

How many mom and pop restaurants could split that $10M? At $50,000 each, that’s 200 restaurants that are likely close to bankruptcy. Unless Congress approves more money and literally approves every loan application that is legitimately submitted, the idea that public companies can drain a small business aid package is a disgrace.

As Markets Stabilize While Peak Infection Rates Loom, Where Should Fresh Capital Go?

My last post highlighted the fact that the U.S. stock market in recent times has tended to find a lot of support around 15x trailing earnings. It appears that equities have calmed down a little in recent days, with a bottom having been made (perhaps temporarily) on March 23rd. On an intra-day basis (2,192) the valuation at the bottom was 14.0x 2019 S&P 500 profits. On a daily closing basis (2,237) it comes to 14.2x and on a weekly closing basis (2,305) the figure is 14.7x.

I am not going to predict that we have seen the lows. Even the experts in the field are merely guessing as to Covid-19’s ultimate infection path and even scarier to me is that I doubt health and government officials even have a plan for a slow loosening of social distancing guidelines, so we really don’t know what to expect from a economic rebound perspective. On one hand, I am comforted that the market did find a bottom around similar levels to recent years’ corrections, but on the other hand this situation is so much different than prior instances that I am not sure it is a very strong comparable event.

So rather than try and guess these things, like so many pundits in the media insist on, I think it is more helpful to think about where fresh capital could be deployed on a long-term basis as we wait this whole thing out. I am finding it too early to average down on more controversial existing holdings (travel-related, for example) because companies have not given us much data yet. Most have disclosed cash balance and credit line availability, but without knowing cash burns rates that only tells us so much.

So then the attention turns to businesses that are publicly traded, beaten down, and are less reliant on credit availability even if they are shut down. Essentially, high quality businesses that are on sale now but typically are not. Sure, there are examples in sectors where headwinds abound (Starbucks down 35%, for example), but there are more obscure ideas too. How about the few publicly traded professional sports teams? How confident are we that sports franchise values will continue to rise over the next 5 years? Even if seasons are cancelled, will the franchises lose 25-35% of their value for a significant amount of time? How often can small investors buy into sports teams at a big discount? Not often.

I know rental income in the near-term is problematic, but seeing owners of hard assets like real estate down 50-70% in a month is startling (and likely an opportunity). And you don’t need to go out and buy mall owners if you don’t feel inclined. How about Ventas, one of the leading owners of medical facilities? The stock is down 65% since February.

How about the big banks that were forced to be well capitalized so they could weather something like this? Jamie Dimon just went back to work after emergency heart surgery and JP Morgan Chase is widely considered the best-run bank in the world. It’s stock is down 40% from its 52-week high.

There are many companies I feel like I need for information from before I can decide whether to cut them loose or buy more shares. There are others where I feel like I can get comfortable given the low price, no matter how the next few months shake out. If you find unique situations where the franchise value is likely very secure and yet the stock is still down far more than the market itself, take notice. You might be surprised what you find. I mean, honestly, should Target stock be down 30% in this environment?

Happy hunting!

Full Disclosure: Long shares of Starbucks at the time of writing, but positions may change at any time

Market Strategists Focus on December 2018 Lows For Support, Does That Make Sense?

It might surprise many investors to know that despite the violent stock market correction over the last few weeks, the S&P 500 index remains above the trough made during the late 2018 decline. Recession fears during Q4 2018 led to a 20.2% bear market from peak to trough over a three-month period, resulting in an intra-day low for the index of 2,346.

Given that 2019 corporate profits were only modestly above 2018 levels, and considering that the economic weakness from COVID-19 is tangible and not just a “growth scare” (like 2018) market watchers who believe a drop back to that 2,346 is possible, or even likely, do not seem out of line to me. Even at this week’s low point (2,478) it would mean another 5% lower and a full 31% drop from the February market peak.

So if the market today is still above the 2018 low, how does it compare to recent years’ lows? I decided to take a look and the data really sheds light on how far the bull market had come before the novel strain of coronavirus crashed the party.

Below you will see the yearly low for the S&P 500 going back to 2014. I have included the peak-to-trough decline in percentage terms, assuming the current bear market reaches each of those price levels.

Despite an enormous drawdown in 2020, the market remains above the December 2018 lows.

Despite an enormous drawdown in 2020, the market remains above the December 2018 lows.

While the percentage drops are severe, it is interesting that even a 34% decline only takes us back to 2017 levels. While that might not sooth investors’ anxiety at the moment, having some context about where we have been does serve to reinforce the long-term equity market trends we have endured during the latest bull market.

I suspect we would see material buying pressure if the S&P 500 dipped down to the low points of 2017 and 2018, unless the virus was truly getting out of control even after governments around the globe took strong and decisive steps to mitigate its spread.

*****

The next logical question to me is what the valuations were at each of these market’s troughs, which can possibly shed some light as to the ultimate magnitude of the current bear market. Below is a chart that shows the P/E ratio on the S&P 500 at each of the low points shown above. I used the actual full year profit figure for each respective year (e.g. the 2014 P/E reflects the low price no matter when during the year it occurred, paired with actual full year 2014 earnings).

Based on the last 5 years, buyers tend to jump in whenever the market P/E nears 15x.

Based on the last 5 years, buyers tend to jump in whenever the market P/E nears 15x.

I have heard a lot of commentary in recent days about how the market might actually be more expensive now than it was a month ago, despite a 25-30% market decline. Their reasoning is that earnings are likely to fall dramatically in 2020. For instance, at the high near 3,400 on the S&P 500 stocks fetched 21.6x trailing earnings. However, if earnings fall 25% this year, the S&P at 2,600 would trade at 22.2x earnings.

I find that argument bizarre. The stock market is forward-looking and during a recession really doesn’t trade based on real-time earnings because those figures are depressed and temporary. I much prefer to use actual 2019 earnings to value the market right now, since we don’t know what 2020 profits will look like and they likely won’t stay depressed for very long. While we also don’t know what 2021 earnings will be, a good starting point in my view would be 2019, if we think the world will normalize again sometime within the next 12 months.

At any rate, if we take 2019 S&P operating profits of $157 and use a 15x multiple, we arrive at a level of 2,355. That level just happens to be right at the December 2018 low (2.346) and 31% below the 2020 all-time high. We will see if that kind of level brings out buyers in force in the coming days and weeks. I would guess the virus pandemic/economy would have to get really bad to materially break those levels for an extended period, but that is only an educated guess and prices can pretty much touch any level on any given day.

As Plummeting Oil Prices Compound Economic Concerns, Here Are 2 Things To Do This Week

Two weeks ago we saw a severe stock market decline, which was followed up with whipsaw volatility but a leveling off of prices overall last week. We are starting this week off with what appears to be somewhat of a panic by short-term market participants, with stock trading halted within minutes of opening Monday morning after a 7% drop (due to a exchange-imposed “circuit breaker” 15-minute trading halt - a rule in place, but never triggered, since 2013). As if the virus was not enough, now we have collapsing oil prices threatening the viability of an entire sector of the economy.

If this week is the first time during the coronavirus scare that stock prices meaningfully diverge from the underlying businesses they comprise (a 2,000 point drop in the Dow in a matter of minutes can do that), I would offer two actions investors should consider:

1) Don’t sell stocks simply to try and relieve the pain and prevent further paper losses in the near-term

While it is never reassuring to see stock prices diverge from corporate fundamentals and traditional company valuation metrics, selling securities when prices are irrational rarely pays off. In order for that bet to work, you need to be able to buy back the stock at lower prices (i.e. at even more irrational prices) in the future.

Not only is such a task extremely difficult when it is one’s main objective, but the very fact that somebody wanted to sell during a period of intense pain probably greatly reduces the odds the same investor would be able to buy back those shares after that pain has intensified.

The two smartest options during periods of near-term market dislocation/panic are to either buy mispriced securities with the intention of holding them for (at least) a year or two if needed, or wait things out until normalcy returns and any transaction you want to consider can be consummated at a fair price.

2) Strongly consider refinancing your mortgage

Mortgage rates have now hit all-time record lows, with the average 30-year fixed rate pushing towards 3.00%. I recommend getting a quote from your mortgage broker to see if the monthly savings from refinancing now is meaningful for you. To get judge the return on investment, I always try to see what mortgage rate I can get that offers a lender credit roughly equal to the closing costs. That way, the deal not only costs you close to nothing out of pocket (excluding the funding of an escrow account, if required by the lender), but also maximizes the ROI on the transaction.

Coronavirus Correction: How Far?

So how far will the U.S. stock market fall as the fear of a coronavirus pandemic tightens its grip on daily trading activity? Since there is no way to know, there is little sense to making a prediction on that front. But that does not mean that we cannot set our expectations based on market history, even if there are no assurances that the actual result will be no worse than said expectations.

Without full blown recessions, market corrections are typically in the 10-20% range. Today I updated a graphic that I had last posted on this blog in early 2016, which summarizes recent corrections in the S&P 500 index. The data now goes back 10 years:

SPXCorrections 2010-2020.png

If the virus starts to slow in the coming days and weeks, the market might stabilize soon, whereas an acceleration will stoke more fear and likely result in moving towards that 20% threshold. A full blown global recession puts 20-40% declines on the table based on historical data.

Editor’s Note (3/6/20): To put these levels into perspective, the S&P 500 peaked on 2/19/20 at 3,393. Corresponding corrections are as follows: -10% (3,054), -15% (2,884), and -20% (2,715). The low point reached so far during the virus-induced market decline was 2,856 (-16%) on 2/28/20.

I have no idea how this virus will play out. If we look at SARS from the early 2000’s, the 10-20% range was adequate and assets rebounded quite quickly. The same is true of the zika, ebola, swine flu, and bird flu outbreaks. An important aspect of investing is using historical data to inform probability-based decisions. Without a crystal ball, all we can really do is try and stack the deck in our favor as much as we can with that data and prior experience.

All in all, my inclination is to buy quality companies on sale, expect that the market decline will mimic those of the last decade, and take a multi-year view on my investments as things get back to normal. While there are no guarantees that strategy will play out as I expect, making an alternative bet of some kind does not have a better chance of success based on market and economic history, which means I have little interest in exploring such paths.

When my clients reach out and ask if I am worried, my simple answer is “no.” Barring a permanent material change in how we live our lives, or how many people there are to fuel the global economy, the economic and financial output of the corporate sector is likely to snap back after a number of months, in which case the market will move on and look ahead to the future.

Plenty of Travel-Related Stocks Ripe for Bargain Hunting with Multi-Year Outlook

I find it interesting that the financial community is making much about the various drug companies working on coronavirus vaccines. History suggests that 90-180 days from now the outbreak will be off the radar and the global economy will be bouncing back. I am not sure a SARS vaccine, for instance, has much financial value these days. These strands of virus tend to have one-off impacts.

Much like during the SARS outbreak, or after the 9/11 attacks, travel stocks are taking it on the chin right now. As a long-term contrarian investor, I cannot help but allocate some existing cash balances into these stocks. 2020 will be a throwaway year from a financial perspective and the markets should relatively quickly refocus on 2021 and a more normalized operating environment.

Does it matter which companies one targets? In many cases, probably not. Having already held Expedia (EXPE), and being only more excited after hearing Barry Diller’s plan to reinvigorate the company’s business, I can’t help but be elated that the post-earnings rally we saw earlier in the month has now been given back completely. I am modeling $10 of free cash flow per share in 2021 (assuming a normalized economy) and the stock is fetching $105. Plug in your expected multiple of FCF and calculate the upside accordingly.

Booking Holdings (BKNG) has more international exposure and reports after the bell today. At $1,675 and about $100 of per-share free cash flow, that one is worth watching as well.

I have also been looking at the cruiseline sector and already had global market leader Carnival (CCL) on my watchlist pre-virus due to a depressed stock price (due to a large capex cycle depressing free cash flow generation). I have begun accumulating shares, as the single digit P/E ratio and dividend yield north of 5% (payout ratio of less than 50% on normalized earnings) appear favorable to historical levels.

To be clear, I am not predicting how bad coronavirus will be, or when travel-related stocks will bottom. Instead, I am taking my normal 2-3 year (minimum) holding period assumption and making a bet that buying high quality travel companies during times of near-term distress will pay off over the long-term. History suggests it will.

With New Market Darling Tesla Surging, Is Its Stock The Next Amazon?

Before today’s pullback, shares of Tesla (TSLA) had more than doubled since the beginning of the year as bears capitulate and admit their bet that the company was on shaky ground financially appears to have been wrong. The company has always had cult-like followers who planned to hold the stock forever, but now with shorts scrambling to cover and momentum traders seeing a near-term opportunity, the stock touched $968.99 yesterday after fetching around $400 a month ago. Profit taking today has the shares in the mid 700’s, which equates to a market cap of roughly $140 billion.

While the last few days feel like an unsustainable bubble, one can make a bullish longer term argument based on wild growth assumptions over the next decade. Even at current prices, TSLA trades for about 5 times projected 2020 revenue, which is not out of line with its history (2.5-4.5x trailing revenue in recent years). The biggest question is not whether 5x sales is crazy, but rather if it is warranted for a manufacturing business. After all, TSLA’s 2019 gross profit margin was just 17% and the overall trend in that metric is hardly positive:

TSLA_margins-2016-2019.png

Prior to Amazon (AMZN), it would have been easy to dismiss the investment merits of a $140 billion market value company that posted a net loss of $862 million in 2019, but Bezos and Company have changed the dynamic for growth stock investors. Now anybody who can imagine large amounts of profits being generated by a business a decade or two into the future can make a bullish argument and justify nearly any stock valuation today.

The narrative that Amazon has lost money during most of its life is a bit of an overstatement (they posted losses in the first 6 years post-IPO and in the subsequent 17 years have earned profits every year except for 2), but the Tesla investment story is the same; they are changing the world and current profits are meaningless. In the 10 years TSLA has been a public company, they have lost money every year.

If Elon Musk does succeed in becoming the number #1 global car maker eventually, and other businesses develop over time to diversify into something other than a low margin manufacturing company, then the Amazon comparison is likely reasonable. With that in mind, I was curious what kind of numbers Amazon was posting when it was Tesla’s current size, and how Wall Street was valuing the stock at the time. This can tell us whether $140 billion for Tesla today is on par with what is likely the most successful business started in the last 30 years. Interestingly, the financial paths are not dissimilar:

In 2009, Amazon posted revenue of $24.5 billion, gross margins of 22.6%, and grew revenue to $34.2 billion in 2010, with similar gross margins.

In 2019, Tesla reported revenue of $24.5 billion and gross margins of 16.6%. The current consensus estimate for 2020 revenue is $32.2 billion.

There are two core differences, however. First, Amazon had racked up 7 straight profitable years by 2009, earning a $900 million profit that year, whereas Tesla lost $862 million last year on the same revenue base. Second, Amazon’s equity market value entering 2010 was $60 billion, less than half of Tesla’s current market value. Add in the fact that Amazon has moved into high margin businesses since (like AWS and advertising), which has allowed them to nearly double gross margins to 41% by 2019, and it seems that Tesla’s stock is far ahead of an Amazon-like trajectory.

So while Tesla might very well be the next Amazon, the current market price is far more exuberant than Amazon’s was a decade ago. That won’t necessarily stop TSLA stock from rising over the long term, but it does imply that its gains over the next decade are unlikely to approach those of Amazon during the prior one.

Meet Apple: The New Consumer Staples Stock

In recent years, Apple (AAPL) bulls have argued that the company is morphing from a seller of technology hardware to a software and services business, which should result in a meaningful increase in the earnings multiple of the shares. I was never really able to buy into that framework because sales of the iPhone were north of 60% of Apple's total business and services was stuck in the low double digits. Getting hardware from 90% down to 80% or even 75% of the company didn't seem like enough of a shift to warrant P/E expansion from the mid teens to the mid 20's, but plenty of folks firmly believed that Apple should have the same multiple as Starbucks or Coca Cola.

Those bulls have been waiting patiently and in recent months the value of their holdings has surged. During Apple's 2019 fiscal year (which ran from October 2018 through September 2019) the company's stock price fell from $226 to $224. In lockstep, the company's GAAP earnings per share fell by the same amount (from $11.91 to $11.89). During those 12 months, the stock's P/E ratio was (obviously) stable and it was clear that the days of P/E's in the 10-12x range were long gone. With slowing revenue and earnings and a reasonable valuation, I held no position in the shares.

Oh what a difference four months makes (evidently). Apple stock since September 30th has been on a tear, making a new high today at just shy of $320 per share. That is a gain of more than 40% in about 16 weeks. What on earth is going on? Well, the multiple expansion thesis is playing out, and fast, even though there seems to be minimal fundamental change in Apple's business.

After declining in fiscal 2019, earnings per share for the company are expected to increase in fiscal 2020, with the consensus forecast now sitting at a hair above $13 per share (10% growth). At $319 and change, Apple's forward P/E is now above 24x. When was the last time Apple's P/E was in the mid 20's? More than a decade ago! Most interesting is that Apple was much smaller and growing revenue extremely quickly back then (annual revenue growth of 47% between 2008 and 2012 thanks to the iPhone, which was released in mid 2007).

aapl.png

Apple shares have more than doubled over the last 12 months, despite little change in the business and hardware as a percentage of total revenue still above 80%.

Congrats to those who hoped Apple would garner a consumer staples multiple in the mid 20's a la Proctor and Gamble, McDonalds, Starbucks, or Coca Cola. I have no view on where the stock goes from here, especially since I never expected the P/E to ascend to this level. All I know is that for a stock that traded between 14x and 17x earnings between 2011 and 2017, when its organic growth was far faster, the current price implies investors are banking on a lot of good news in the coming years. So while the bar was previously set quite low for the company, due to trading at a material discount to the market, Apple's financial results will have to meet or exceed far elevated expectations to maintain a premium valuation. In a way, it signals that investors are banking on growth once again, and the dividend yield is now down to only 1%.

It will also be interesting to see how Wall Street analysts react to this latest stock price spike. Will they keep raising their targets or go to a more neutral stance? Amazingly, the average consensus price target for Apple among the 44 analysts who cover the name is $290 per share, or about 10% below the current quote. Only about half (23) have buy ratings.

While I would not short Apple unless than P/E got to nosebleed territory (say, 30+), I see little reason to own it at 24x forward earnings after a massive run. If investors value it more like a blue chip consumer brand going forward, the current price indicates that its equity returns will likely fall into that category as well.

Reevaluating the Bullish Investment Thesis on The Howard Hughes Corporation

When the Howard Hughes Corporation (HHC) was spun off from General Growth Properties during its bankruptcy process in late 2010 it was an underfollowed, relatively unknown collection of unrelated real estate assets mostly located within a few master planned communities in Hawaii, Maryland, Nevada, and Texas. The communities were vibrant residential and commercial hubs in their respective local markets and HHC owned thousands of acres of vacant land that would allow for decades of future development, either by the company itself or by third parties who would buy the land or partner with HHC.

The investment thesis was very compelling for long-term investors willing to wait 5, 10, or even 20 years; HHC will sell vacant land to homebuilders and use the proceeds to build and lease office buildings, retail shopping centers with ample restaurants, multi-family residential buildings, hotels, etc. to make the area even more desirable. The population growth would lead to ever-increasing land prices and the process could be repeated until there was no land left to build on, creating plenty of value for shareholders.

The key aspect that set HHC apart from other real estate developers was that they owned the vacant land already, enough for 2 or 3 decades of construction activity, which meant they could fund commercial construction projects with cash generated from land sales, not by borrowing from banks and racking up debt like most of their peers. That strategy would allow for less leverage and more value would accrete to equity holders rather than creditors.

The success of HHC stock in the eyes of their investors over the last decade varies greatly depending on when each of us got in (as one should expect). Most of my clients have made money in the name, but I also bought some when sentiment was high and it was fully priced in the near-term (the idea was that for a such a long-term investment, the entry point was a little less important than in other situations) and those blocks are flattish at best and slightly down at worst.

The exact buy price probably would have been relatively unimportant had the thesis played out exactly as expected. But, that has not been the case. Now I am left with a stock that is up nicely from its 52-week lows and remains included in many accounts I manage (as well as my personal portfolio). The question is, should we sell or keep holding it?

First, let me share some data to illustrate why HHC has not been the very unique public real estate developer many had hoped for since 2010. The bull thesis (that HHC would handsomely outperform other similar public real estate stocks) hinged largely on the idea that debt financing needs would be reduced due to a constant stream of cash coming in from vacant land sales. On the face of it, this looks like it should have played out, as HHC has booked cumulative land and condo sales of $4.32 billion from 2011 through September of 2019. Gross profit on those sales comes to a whopping $1.85 billion.

Flush with cash, HHC did what it said it would do; build a heck of a lot of leasable commercial real estate and own the properties long term to generate a consistent stream of rental income (that Wall Street would theoretically love). Sure enough, HHC's rental income had risen from $95 million in 2010 to $396 million by 2018.

If HHC had simply reinvested the $1.85 billion and generated an incremental $300 million of annual rental income (worth about $3 billion of equity value at a 10x multiple on gross revenue), the total return for shareholders on that investment would have been 62% and proven out the bullish thesis in a powerful way.

So far so good, right? Maybe, but there is one problem; debt at HHC has soared right alongside land sales, construction activity, and rental income. Rather than build properties with minimal debt financing, setting themselves apart from their peers, HHC has funded their construction costs via traditional methods. At the end of 2010, total net debt on the books was merely $34 million ($285 million of cash against debt of $319 million). As of year-end 2018, that figure had swelled to a stunning $2.68 billion ($500 million of cash against $3.18 billion of debt).

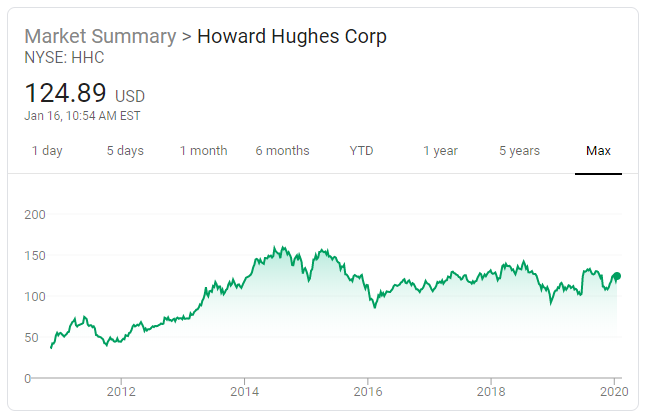
If you realized what HHC was in the early days once it started trading, it was undervalued enough that none of the above mattered. The stock closed its first trading day in November 2010 at $38 and nearly doubled to $73 by year-end 2012. However, since then the ever-rising debt load has held back the stock, which closed out 2013 at $120 and has been treading water ever since (albeit in volatile fashion which has afforded investors trading opportunities along the way):

hhc.png

The company ran a strategic review process in the second half of last year that resulted in a stock price spike, allowing me to pare back and/or hedge most of my positions in HHC. There was a glimmer of hope after no buyers for the company emerged in that management announced it would sell non-core properties, focus on its main master planned communities, materially cut G&A costs, and use excess cash flow to repurchase stock that they felt was undervalued. That plan resonated with me and gave me hope that the debt pile would stop rising so fast and perhaps some equity-friendly moves were on the horizon.

That optimism was short-lived, however, with the December 30th announcement that HHC agreed to acquire from oil giant Occidental 2.7 million square feet of office space for $629 million, to be funded with $231 million of equity and $398 million of additional debt.

Bulls would argue that given their plans to sell part of the assets being acquired (a campus outside of the Woodlands), the remaining deal to buy 2 office towers within their most mature community is a good move. And considered by itself, perhaps they are right. My issue with it is that it represents more activity that does not set HHC apart (using internally generated cash flow to grow their commercial property portfolio). Having HHC borrow money to buy existing buildings at fair market prices is the playbook that every other real estate company is employing, which means the long-term unique investment thesis for the company remains elusive.

There have been other missteps too. The South Street Seaport in New York City was supposed to be a trophy asset for the company, as it held a long-term ground lease and planned to rebuild much of the area around Pier 17 as a premier destination for locals and tourists alike:

pier17.png

What management had originally thought would generated above-average returns quickly turned into a money pit. The original construction budget of nearly $500 million was supposed to generate double-digit returns, but delays and redesigns has seen the cost estimate surge past $700 million. Management is still maintaining the goal of the property eventually earning $40 million to $50 million annually (making it an average project, at best), but the Seaport is currently losing money and will take years to reach that goal, if it ever does.

To make matters worse, we learned last year that HHC has decided to move away from its typical business model (leasing space to tenants) and instead has co-invested in many of the Seaport businesses, even choosing to operate some themselves. They claim there is more upside potential by structuring deals as joint ventures, but they are supposed to be landlords collecting rent and leaving the risk for the business owners. Now they have business losses offsetting rental income, which will reduce returns on the project further.

The nail in the coffin for me was their $180 million purchase of a parking lot adjacent to the Seaport in mid 2018. As they began due diligence on erecting a building at the site, they discovered that the parking lot had once been the site of a thermometer factory and contained toxic levels of mercury, as well as petroleum leaks. Parents of student from a nearby school are freaking out at the prospect of a demolition project potentially exposing children to toxic chemicals, which is delaying HHC's timeline for hiring professionals to clean up the site. Count me as one who hoped HHC would find a buyer for the Seaport last year when they shopped the company's assets, but no such luck.

All in all, without a path forward that includes revenue growing materially faster than debt, I am not sure there is a unique story here for HHC investors anymore. Between December 2013 and September 2019, rental revenue has grown by 165% while gross debt has grown by 139% and net debt by 282%. It is hard not to think that is a major reason why the stock price has barely budged during that time. Unless and until the financial strategy changes, maybe HHC isn't all that special. While it seemed like the ultimate long-term buy and hold stock when I first discovered it back in 2011, today it might no longer warrant such praise.

Full Disclosure: At the time of writing, the author and some of his clients were long HHC, but those holdings are currently under review for possible sale and positions may change at any time.