Momentum Trading Cuts Both Directions

Back on Monday October 19, 1987, the Dow fell 508 points, which was a decline of more than 22% in a single day. Today that same decline equates to roughly 2%. With the Dow trading at such high levels, in absolute point terms, a large decline might seem scary if not presented in percentage terms. The same is true when the financial media likes to focus on every 1,000 Dow points, as if a move from 25,000 to 26,000 is anything more than a simple 4% gain that historically takes less than 6 months, on average.

So rather than care about "a 1,000 point Dow decline!" let's look at a one-year chart of the S&P 500 for some perspective:

SPX-FlashCrash.png

As you can see, all we have done over the last two days, when the Dow has dropped 1,600 points, is give back the gains booked in January! When I look at this chart, I don't see the mother load of all buying opportunities yet. I probably would not get even a little bit giddy about buying U.S. stocks unless we got back down to 2,400 or 2,500. That does not mean it will get there, or that I think it might (I -- like anybody else -- have no clue).

Momentum markets work in both directions, and when computerized algorithms conduct much of the daily trading in the stock market, moves like we see today can happen with ease, and most importantly, without tangible "reasons" behind them.

Most of the time I wish we could go back to the days when stocks were less volatile, a 10% correction occurred about once a year, on average, and the media did not over-hype days like today. It will make for good, scary headlines, but that's about it.

Amazon Shares Pierce $1,430 And Sit Firmly Above 3x 2018 Forecasted Revenue

Valuing shares of Amazon (AMZN) has always been a difficult task since the company does not at all care about short-term profit margins. Investors are left with trying to estimate, based on the company's various businesses, how large each will get and what type of margins will likely be achieved once each reaches maturity.

Of course, such an approach becomes nearly impossible when you have no sense of which businesses Amazon will choose to enter over time (or maybe the better question is which they will "not" enter). Traditional retail was one thing, but now with cloud services and advertising revenue, margins are going to be all over the map.

I recently trimmed many of my clients' positions, as I have done once or twice since I made the investments beginning in 2014. My methodology has been inexact, to account for the aforementioned issues regarding Amazon's various ventures, but it generally involves looking at AMZN on a price-to-sales basis and then seeing what margin/multiple assumptions are baked into such valuations. For instance, if you think they will ultimately earn a 10% profit margin at maturity, you might be willing to pay 20 or 30 times normalized profits, which would equate to 2-3 times annual revenue.

Given the company's growth, my personal view is that anything up to 3x revenue is at least somewhat reasonable, as I don't see margins going above 10% given the company's desire to remain value-based in the eyes of consumers, and anything over 30x profits for a growth company makes me nervous. And if someone argued that they will never reach 10% margins and a 30x multiple is too high, I can totally understand that view. I just think some valuation flexibility is warranted given that Bezos might actually get as close as anyone in business to total world domination.

So below I have posted updated graphs that show Amazon's stock price over the last two decades or so (not very helpful when trying to evaluate the valuation), as well as their year-end price to trailing 12-month revenue ratio (far more helpful in doing so). Note: the 2018 data points are based on today's stock price and consensus 2018 sales estimates.

AMZNat1425.png

As you can see, AMZN stock hovered around the 2.0x price-to-sales ratio level between 2004 and 2014, with a range of 1.5x-2.5x or so. In recent years, as momentum stocks have led the market higher, that number has surpassed 3x and currently sits around 3.2x.

Given that position sizing in portfolios is always important to me, this graph tells me that now is not a bad time to trim AMZN. Trading above 3x revenue would seem to indicate that investor sentiment is quite high. There may be good reasons for that, of course, but as the company gets bigger and bigger, its growth rate is sure to slow. In fact, in order to grow by the 29% rate that Wall Street analysts are expecting in 2018, total sales need to rise by a stunning $51.5 billion. That very well might happen (and acquisitions like Whole Foods will only help), but when growth slows to only 10 or 15%, investors might not want to pay 3.2x revenue any longer. In my mind, anything above 3.0x tells me to tread carefully.

What do you all think? What kind of profit margins do you think AMZN will earn at maturity (i.e. when its growth rate is in-line with the average company)? What multiple of revenue seems right to you?

Full Disclosure: Long shares of Amazon at the time of writing (even after selling a chunk at $1,400 recently), but positions may change at any time

What A Difference A Strong Holiday Season Makes: Retailing Stocks Back From The Dead

Back in the second quarter of 2017 I wrote a four-part series of posts on the bricks and mortar retailing sector (Part 1: department stores - DDS & KSS | Part 2: mall owners - SKT & SPG | Part 3: balance sheet strength | Part 4: possible LBOs - JWN, DDS, URBN) focused on how Wall Street was pricing many companies as if they were essentially finished as profitable businesses.

Here we are after a strong holiday shopping season where online and bricks and mortar stores shared in the cheer and investor sentiment has shifted dramatically. This is notable because the businesses are the same today as they were back in May and June.

While the mall operators are largely unchanged, aside from above-average dividend payouts, profitable retailers with strong balance sheets have been on a tear. For example, Kohl's (KSS) is up nearly 100%, hitting $67 today on an analyst upgrade. Similarly, Urban Outfitters (URBN) has doubled from $17 to $34 and Dillards (DDS) has jumped nearly 50% from $48 to $70.

The Kohl's situation is interesting because the stock is jumping $2 today after a Jefferies analyst raised his price target by a whopping 50% to $100 per share (from $66). If that sounds like a crazy number, it is. While I was positive on the company in the $35-$45 area, after a move into the 60's it warrants a skeptical eye going forward.

I had been using a $60 fair value estimate, based on 6x EV/EBITDA and 10x free cash flow. After all, this is a department store chain that will report lower revenue in 2017 ($19.0 billion) than it had five years ago in 2012 ($19.3 billion) and I wanted to use conservative estimates. Profitable and stable off-mall retailer? Check. Solid balance sheet with lots of owned properties to offer a margin of safety? Check. Growth company that stands to take market share? Not so much.

Slow/no growth department stores (JCP, DDS, M, KSS) have traditionally traded for 6x EBITDA. Unless you believe KSS can grow their business materially, a $100 stock price seems overly aggressive at 9x EBITDA and 17x free cash flow.

Although retail sales will continue to rise in the low single digits thanks to inflation and population growth, department stores will likely still cede market share slowly over time to online channels, as well as new store concepts. That trend likely explains KSS's flattish five-year sales performance.

After a huge run, investors now believe that these companies will survive and do decently well, which is a huge shift in sentiment from 6-12 months ago. I consider many of the stocks trading at/near a fair price today, especially considering that revenue growth will still be hard to come by. In addition, the odds are low that media headlines focusing on the Amazon  threat, dead malls across the country, and bricks and mortar bankruptcies are a permanent thing of the past. Like many trends in the financial markets, I suspect we will get another good entry point in traditional retailers down the line when sentiment shifts yet again.

As for riding KSS from $67 to $100, I will leave that bet for Jefferies to make, as the stock is far less attractive today from a risk-reward perspective than it was at $36 last year. Most of these stocks seems like contrarian, sentiment-timed intermediate term trading vehicles more than multi-year, buy-and-hold investments.

Full Disclosure: Long shares of AMZN common, DDS debt, JWN common, KSS common, and SKT common at the time of writing, but positions may change at any time.I have been selling down existing positions in KSS recently, although not every share has been sold yet. 

With Boeing Trading For 28x Earnings, Is The Bull Market In A Melt-Up Phase?

I do not spend a lot of time on cyclical stocks and the industrials and materials sectors are not well represented in portfolios I manage. Lack of expertise is one reason, but another tricky part of investing in cyclical companies is that you need to have a decent sense of their business cycles and that is not easy unless you have some specific experience in the industry.

That said, sometimes I dabble when I can get comfortable enough with the company and stock price simultaneously. In early 2016 that combination was staring me in the face after a sell-off in Boeing (BA) prompted me to buy at prices as low as $105 per share. I do not even recall what the particular short-term Wall Street worry was at the time regarding Boeing's prospects, but if you are going to feel good about the competitive positioning of a large U.S. manufacturer, BA has got to be near the top of the list (nearly impenetrable market share, minimal competition, and fairly predictable product demand).

In 2015 Boeing had posted GAAP EPS of $7.44 per share, up modestly from 2014 and a new company record. At $105 each, the beaten down stock in early 2016 was trading at a trailing P/E of 14x and had posted free cash flow in excess of GAAP earnings for four straight years. It was a classic situation of getting a great business for a very reasonable price.

Boeing shares snapped back quickly, reaching $135 in less than two months. Earnings for 2016 were estimated to rise modestly again, which put the stock at 18x current year earnings, or nearly a market multiple for a cyclical business that was on pace for a fourth consecutive year of record earnings per share. As a result, I rang the register and was pleased with a 20% gain in a very short period of time (the IRR on the trade was over 1,000%).

Today, nearly two years later, Boeing stock closed at $320 per share:        

BA-jan2018.png

What on earth is going on here?

Company management projects GAAP EPS of $11.30 for 2017 (fourth quarter results are due out later this month), which would be 48% above 2016's record level. Boeing is trading for 28x trailing earnings, versus the S&P 500 at 22x.

Since when do cyclical stocks earning peak margins trade at premiums to the overall market? Isn't it usually the other way around? Don't investors in cyclicals typically pay high multiples on depressed earnings and lower multiples well into the upswing of a business cycle?

Other cyclical companies have seen steep share price climbs lately as well:

CAT-jan2018.png
DE-jan2018.png

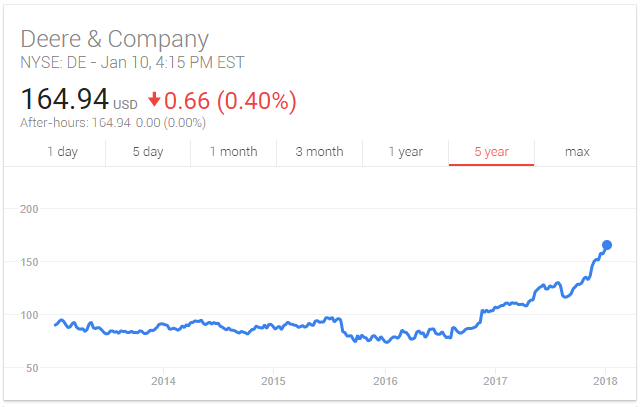
This bull market is producing some oddities no doubt. Not too many people would believe that nearly a decade into this economic expansion Boeing would fetch a higher valuation than Google (based on 2018 earnings estimates - CB 1/12/18), but that is exactly the case today. What does it mean? It is hard to say.

Maybe investors truly believe we are in the early innings of the economic cycle and Boeing's earnings are set to soar more than they already have. Maybe the computer algorithms have taken over and just bid up every momentum-driven stock, regardless of what history would tell you about investing in cyclical companies. Maybe we are entering a melt-up/bubble phase and this market will ultimately hit a P/E ratio of 25 or 30x, with the biggest companies benefiting most due to huge index fund inflows. Maybe putting on a long Google/short Boeing paired trade today will look brilliant five years from now.

Thoughts on Boeing's valuation? Please share.

Full Disclosure: No position in Boeing at the time of writing, but positions may change at any time

Not All Media Companies Are Created Equal: A Closer Look at Charter, Comcast, and Disney

A client reached out to me after reading my past post regarding the media industry landscape to point out that Comcast and Charter, while both in the business of providing video, data, and voice services to customers, are far from equal when it comes to revenue diversification.

This is a point that is certainly true. I probably should have been more specific in my prior post that my comments were meant to be focused on the TV business. With Comcast's NBC Universal acquisition about eight years ago, the company became far more than just a cable company offering triple play packages to mostly residential customers.

Along those lines, Charter is a far more one-sided investment bet than Comcast is these days, and would be more susceptible to people who are cancelling their cable service and instead opting for Netflix and/or Prime Video.

Since these companies, along with Disney, have various business segments, I thought it would be helpful to illustrate where each gets its revenue from. The answers are a bit surprising.

Below is a chart that shows the percentage of total revenue that each media company gets from various businesses. Since Disney's 2017 fiscal year is already over, I am showing data for their latest 12 months. For Comcast and Charter, only the first nine months results for 2017 are publicly available.       

Media-Diversification.png

In my mind, there are a few notable things about this data:

  1. Disney is the most diversified of the three, as one might expect. More than 55% of their revenue comes from sources other than television.

  2. 40% of Charter's subscriber revenue comes from TV packages. This is comparable to, but lower than, Comcast's non-NBCU division (44%).

  3. Because of Disney's large parks/resorts segment (33% of revenue), they have less exposure to cable despite owning ESPN. Still, it is a large portion of the company at roughly 30%.

  4. If you want to play increased broadband adoption and higher speeds/prices over the longer term, Charter is actually the best option, as 34% of their subscriber revenue comes from high-speed internet services. The comparable figure for Comcast is just 17% (28% if you exclude the NBCU division).

As with any publicly traded security, price should play a material role in drawing conclusions about the merits of an investment. When I look at the valuations, Charter trades at a similar level to Disney, despite having no content library or dominant consumer franchises. Comcast trades at roughly a 10-20% discount to them, even though one might expect it to trade at a premium to Charter given the diversification of their revenue stream in an uncertain and ever-changing media landscape.

As a result, my personal rankings considering valuation, revenue diversification, and franchise positioning, would be 1) Disney, 2) Comcast, 3) Charter. If I was into the paired trade strategy, long Comcast/short Charter would look interesting over a multi-year period. Of course, the big question is whether Charter will make a play for a content business, or wireless provider, or something else to expand their horizons. In that scenario, the outlook would really depend on who they bought and how much they paid, not surprisingly.

Content Providers Take Leadership Role in "Unbundling" of Cable

As we head into 2018, one of more interesting sectors among those I watch closely would have to be the media space. This year has seen a huge amount of deal activity (both discussed and completed), as well as a continued secular shift in the way content is distributed and purchased.

For years consumers and industry watchers contemplated if and how the cable bundle would come undone. The idea of paying for 100 or 200 channels, while only actually watching a dozen or so, seemed like an obvious target for disrupters, but for a long time nothing changed. The cable and satellite pay-TV providers would have been obvious candidates to initiate a change in how content is sold, which easily could have increased satisfaction scores and retention rates among consumers, but they balked at potentially bringing down their "monthly ARPU" (monthly average revenue per user). Now with so-called "cord-cutting" becoming a reality, it appears that perhaps that lack of action was a mistake.

The blossoming of Netflix shows just how much "unbundling" was the right move. It turns out that the content players have now taken a leadership role in doing away with the expensive, voluminous TV bundle. If you think about the Netflix service it really is just "a skinny bundle." Rather than pay $75 or $100 for 100-200 channels, Netflix provides enough content for consumers to be happy (I am just guessing, but perhaps 5-10 traditional cable channels worth of content library?) for $10-$12 per month. Given what industry watchers have been predicting for what seems like decades, it should not be surprising that Netflix has been a runaway success, Amazon Prime Video was created, and HBO is flourishing with its over-the-top streaming service despite more competition.

What is surprising is that the cable and satellite companies have been so slow to react. Leaders like Comcast and Charter have yet to answer with their own competing products. DirecTV did launch a $35 streaming service featuring a more limited channel line-up, so we'll give them credit for taking the plunge.

The big question is how the Comcasts and Charters of the world are going to compete as the content companies try and eliminate them as middlemen. HBO, Netflix, and Prime Video are sold direct to consumer and other content producers are now accelerating M&A activity to gain scale in content. I recently made a list of 60 top TV channels to see exactly how the concentration of ownership has been shifting lately, especially after three recent deals were announced; Discovery buying Scripps, AT&T buying Time Warner, and Disney buying much of 21st Century Fox. Assuming all of those deals close, below is the breakdown:

Disney/Fox: 12 channels

Comcast/NBC: 11 channels

Discovery/Scripps: 10 channels

AT&T/Time Warner: 8 channels

Out of 60 channels, it is entirely possible that just 4 owners will control a whopping 42, or 70% of them, within the next 12 months.

And more deals could be ahead. A remarriage of CBS and Viacom has been long-rumored and combined they own another 9 channels. A company I am invested in, AMC Networks, owns 3 channels on my list.

To me is seems pretty clear what is going on here. The infrastructure players have been slow to adapt to suit consumers' needs. The legacy content companies see Netflix and Amazon spending billions on content and realize that if they are not careful, those two companies could offer so much programming that households might no longer need to watch any of their shows. So rather than stand by and watch, they are getting bigger through M&A and will have enough selection to offer their own streaming service, cutting out the cable and satellite providers completely, while also becoming increasingly crucial for those who stick with a bigger bundle. Disney specifically is going to be in great shape given that they also have an unmatched movie collection that can be offered alongside TV programs.

If this is the internal corporate strategy, we can expect more M&A to be announced in 2018. From an investor standpoint, there are attractive opportunities outside of the profitless Netflix and e-commerce juggernaut Amazon.

AMC Networks trades at about 10x free cash flow, 8x EBITDA, and has been buying stock aggressively. In an age of scale mattering, they would seem to be a logical M&A participant. The post-merger Discovery trades at less than 10x free cash flow, has plenty of synergies to exploit with Scripps, and is internationally diversified. Their focus on non-scripted reality shows keeps production costs low and profit margins high. Disney is building a Goliath in the space and is probably the most likely candidate to create a service that can become as valued as Netflix or Prime Video in many households. At roughly 20x free cash flow and 11x EBITDA, the stock no longer trades at a premium to the market (based on ESPN viewership issues), but arguably should given their unmatched franchises.

The media space is not without investor fears, and it certainly is not a popular group for the current bull market, but there are plenty of strong, cash flow generating machines in the public markets whose share prices are quite attractive due to concerns that Netflix and Amazon will crush everyone and that young people simply don't watch TV. The financial results from these companies in recent years, even as all of this industry change has been afoot, disproves those theories. Additionally, further M&A will only serve to boost competitive positions and generate accretive returns for shareholders.

Full Disclosure: Long shares of Amazon, AMC Networks, AT&T, Discovery, Disney, and Time Warner (hedged with covered calls) at the time of writing, but positions may change at any time

A Year-End Update On Wynn Resorts

While value investing in 2017 has not been an easy task, one constant bright spot in my managed accounts this year has been casino operator Wynn Resorts (WYNN), which has been on an absolute tear.

WYNN-Dec-2017-165.png

My last update was back in May when I outlined how my conservative $150 fair value estimate was likely going to prove to be just that... too low. Since then the shares have continued their ascent, rising from $125 to $165 each. My prognosis from eight months ago ($160 by 2019) is therefore outdated.

While I have been trimming my WYNN positions as the stock has continued higher, the company continues to impress from a financial results perspective. My original $150 fair value figure was based on 15x annual free cash flow of $1 billion, which seemed to be very achievable once the company's second Macau property, Wynn Palace, opened last year.

Despite ongoing construction in the area, which has limited street access and visibility for the new resort, WYNN's numbers have been staggering, as cannibalization of their legacy property in the region (Wynn Macau) has been far less than many analysts expected. In fact, over the last 12 months for which we have reported financials (Q4 16-Q3 17), Wynn has posted operating cash flow of more than $1.5 billion. If we assume maintenance capital expenditures of $300 million annually, my $1 billion free cash flow target for the three resorts now open will prove to be be too low to the tune of $200 million or more. I would say $180 per share is probably closer to the right number for the core properties, and that assumes no future growth from those assets.

And then of course we have the Boston resort currently under construction (due to open in mid 2019), as well as phase 1 of the company's Paradise Park expansion project in Las Vegas which could be open within a year. I continue to see those two projects adding $16 per share to my valuation, which means WYNN stock could see $200 per share without being aggressive in one's underlying financial assumptions. In gaming parlance, it probably makes sense to reduce your bets but I am not getting up from the table completely just yet.

Full Disclosure: Long shares of WYNN at the time of writing, but positions may change at any time.

No Bitcoin Bubble Here: Pink Sheet Listed CRCW Market Cap Hits $10 Billion

If you were an active investor back in the late 1990's you probably remember what the climate was like during the dot-com bubble. All a company needed to do was issue a press release announcing they were going to launch a web site to sell their product online and their stock price would skyrocket. This CNET article on oldies music marketer K-Tel, which saw a 10x jump in share price in just a month back in 1998, offers a good refresher.

The current bubble in cryptocurrencies is worse, in my view, because unlike the Internet (which many will agree was the most important innovation of that generation) it is not clear that we really have any need for virtual coins, which like any collectible will see their value swing wildly based on what someone is willing to pay for them on any given day. Maybe I am just ignorant and will be proven wrong in coming years, but I don't see why a bitcoin is any different than a piece of art, a baseball card, or a beanie baby. They all have a finite supply and little or no intrinsic value.

If you need evidence of a bubble in bitcoins and the fact that the price has gone from $3 when I first heard about them in January 2012 (Featured on Season 3/Episode 13 of CBS's "The Good Wife" - streaming available for free on Amazon Prime Video) to $17,000 today is not enough, look no further than shares of The Crypto Company, an unlisted stock trading on the pink sheets under the symbol CRCW.

On November 15th, The Crypto Company announced financial results for the third quarter. There is no business here. Revenue came in at whopping $6,000 (consulting fees). Cash in the bank stood at $2.6 million, plus another $900,000 worth of cryptocurrencies.

How much is a company with a few million dollars of assets and no operating business worth? Well, the stock closed that day at $20, giving it a market value of $415 million (~20.7 million total shares outstanding).

But wait, that's not the crazy part.

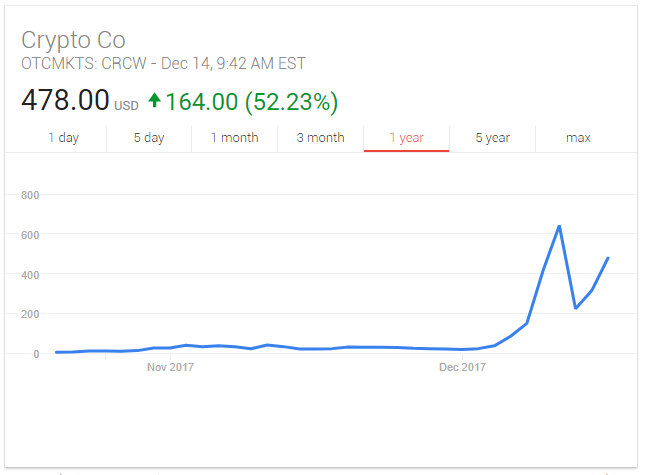
Shares of CRCW have surged nearly 24,000 percent in just 30 days since then, valuing the company at $10 billion. That is a bubble, folks. 

CRCW-478dollars.png

AutoZone Three Months Later: Sentiment Shifts Dramatically Again

We are not quite three months from my last piece on AutoZone (AZO), which back in mid September was in the midst of a nasty stock price decline, and now investors seem to feel a lot better about the company's business. Of course, this is bizarre because AZO is a very large player ($11 billion of annual revenue) in a very stable industry and should therefore be mostly insulated from stock market volatility and immense shifts in short-term investor sentiment.

Below is the five-year stock price chart of AZO I shared back in September when investors were overwhelmed with negativity:

AZO-PPS-5year.png

And here is an updated version that shows the last 12 months:

AZO-Dec-2017.png

Why exactly a company of this size, with no material change in its business outlook could trade for as low as $497 on August 15th and as high as $763 on December 5th shows just how much the current bull market has lost a sense of rationality. That is a 53% move, for a $20 billion market cap company, in a matter of months.

So how does this happen? My guess is that the markets today are mostly driven by index funds, exchange traded funds, hedge funds, and computerized algorithms. The fundamental bottom-up investors are dwindling in numbers by the day. It is not uncommon for me to meet people who are struck by the notion that I pick individual stocks. The market has been so strong for the last nine years that indexes are now considered to be the only wise investment. It is amazing how much views shift based on where we are in the market cycle. You didn't have famous investors extolling the virtues of index funds from 2000-2008 (a nine-year period where the market had negative average annual returns), but now that the following nine years have produced +15% average annual returns, all of the sudden they are a "no-brainer" investment.

As someone who strongly believes in the cyclicality of the economy, financial markets, and investor sentiment, the AutoZone example is evidence that picking individual stocks is not silly and the markets are far from efficient. Moves like those in AZO in recent months make my job much more difficult in periods like this, when individual stock moves often make little or no sense based on fundamental research, but as long as opportunities continue to present themselves, I plan to maintain my role as an active manager of client assets. There will always be a place for index investing (for my clients it is mostly through their work retirement plan), but the ease at which it produces stellar returns will continue to ebb and flow with the market cycle.

As for AZO itself, it is hard to argue the shares are anything but fairly valued today. It will be hard for the company to grow their business (in unit terms) given the maturity of the U.S. economy and online competition, and the stock now trades for roughly 18x my estimate of normalized fee cash flow, versus just 12.5x when the shares fetched $500 each. That sounds about right to me.

Full Disclosure: Long shares of AutoZone at the time of writing (holdings have begun to be reduced recently and those trades will continue into 2018), but positions may change at any time