Rising Interest Rate Shock: 2019 Edition

Back in February I published the table below to show investors where the S&P 500 index would likely trade if interest rates normalized (10-year bond between 3% and 5% is how I defined it):

SPX-scenarios.png

Published 2/27/18

The point of that post was to show what the typical equity valuation multiple was during such conditions (the answer is 16x-17x and we don't have to go back too far to find such conditions). Now that 2018 is coming to an end and earnings are likely to come in at the high end of the range shown in that table ($157 is the current consensus forecast), let's look ahead to 2019.

I have added a gray section to the chart (see below) to include a range of profit outcomes for 2019. The current forecast is $176 but I believe there is more downside risk to that than upside, so I did not add any outcome in the $180+ area.

SPX-scenarios-Oct2018.png

As you can see, the equity market today is adjusting rationally to higher rates, with a current 16.1x multiple on consensus 2019 profit projections. The big question for 2019, therefore, is not huge valuation contraction. Rather, it comes down to whether earnings can grow impressively again after a tax cut-powered 26% increase in 2018. If the current consensus forecast for earnings comes to fruition, the market does not appear to be headed for a material fall from today's levels.

Given that the long-run historical average for annual earnings growth is just 6%, assuming that in the face of rising rates the S&P 500 can post a 12% jump in 2019 seems quite optimistic to me. Frankly, even getting that 6% long-term mean next year - resulting in  $166 of earnings - would be solid.

For perspective, at that profit level, a 16x-17x P/E would translate into 2,650-2,825 on the S&P 500, or 3% lower than current quotes at the midpoint. Add in about 2% in dividends and a flattish equity market overall seems possible over coming quarters if earnings fall to post double-digit gains next year and valuations retreat to more normal levels.

Would Moving To Six Month Financial Reporting Solve Anything?

News that President Trump has asked the SEC to study the potential benefits of moving from quarterly to biannual financial reporting for public companies has stoked a debate as to the merits of such a proposal.

While it is certainly true that short-term thinking, often motivated by the desire to please Wall Street, should not be a focus of management teams of public companies (I can’t stand it when I see quarterly financial press releases tout how actual results beat the average analyst forecast), I am not sure that six-month reporting would materially help solve the problem. From my perch, there are several reasons why I would not expect much to change if such a proposal was enacted:

  • Many companies already do not spend time predicting or caring about short-term financial results, and those firms adopted such a strategy on their own. They did so because the boards and management teams of those firms decided it was the best way to run their business. Those calls fall under their job descriptions, and they take them seriously regardless of what guidance they receive from regulatory bodies.

  • For companies that choose to give forward-looking financial guidance today, they would likely continue to do so on a six-month basis. If they tried hard to hit their quarterly numbers, sometimes doing so at the expense of longer term thinking, the same would be true when dealing with six-month financial targets. Behavior would not change, just the outward frequency of such behavior would.

  • Reducing the frequency of financial reporting would only serve to make companies less transparent with their own shareholders. Since we are talking about public companies that are serving their shareholder base first and foremost, it should be up to the investors to voice concerns about what metrics are being prioritized at the management and board level. There is a reason activist investing has found a place in the marketplace (and the goals are not always short-term in nature, despite media claims to the contrary).

  • Just because companies are required to file quarterly financials does not mean they need to spend much time on them, or communicating them. Jeff Bezos likes to brag to his shareholders at Amazon's annual meetings that the company has no investor relations department and does not travel around the country to tell their story to the investment community. He does not think it is a good use of his time. Plenty of smaller firms simply file their 10-Q report every 90 days and hold no conference call to discuss their results. In essence, they spend minimal time on financial reporting (10-Q reports are not super time consuming when the same template is used every quarter and the company has to close their books every period regardless of external reporting requirements).

  • There is an argument that less frequent financial reporting will result in more volatile stock prices when companies do publish their financials. Essentially, if things are going unexpectedly, the surprise could be twice as large if the gap between reporting periods is twice as long. For many companies, this might be true. But I am not sure of the net impact, given that it can work the opposite way too. If a company has a poor Q1 but makes it up with a strong Q2, it could be a wash when it comes time to report mid-year results, whereas quarterly reports would have resulted in surprising investors twice, in opposite directions.


    It seems the core problem people are trying to solve here is the focus on windows of just 90 days from a management and investor perspective. I firmly believe that whether a company takes a long term view, at the possible expense of short-term results, or not, that decision is a reflection of top management and the board, with input from shareholders hopefully playing a role. If that is true, then reporting frequency itself is not the core determinant of the behaviors we see. As such, we should expect companies to continue their chosen management styles and strategies, whether they have to publish financial reports every 3, 6, or even 12 months.

    From an investor standpoint, if I am going to be given information less frequently, I would want to at least believe that performance will be superior, in exchange. In this case, I do not see how six-month reporting would benefit shareholders by changing behavior at the corporate level, leading to improved revenue and earnings growth over the long term.

    If a simple financial reporting rule change would dramatically change decision making inside public companies, then the same managers who are pushing for six-month reporting should take responsibility for how they are running their companies and simply de-emphasize short term results.

    They can do so without rule changes at the SEC, and they can go further if they want. For instance, there is no rule that says you need to host quarterly conference calls after reporting earnings. Companies could easily host one or two calls per year if they chose to (or none for that matter), which would send a clear message to their investors and free up time (albeit not that much) to focus on the long term.

Are Stock Buybacks Really A Big Problem?

I read a recent article in the Wall Street Journal entitled The Real Problem with Stock Buybacks (WSJ paywall)  which spent a lot of time discussing multiple pitfalls of stock buybacks and touched on some lawmakers in Washington who would like to limit, or completely outlaw, the practice. To say I was dumbstruck by the piece would almost be an understatement.

Let me go through some of the article's points.

First, the idea that the SEC should have the ability to limit corporate buybacks, if in its judgment, carrying them out would hurt workers or is not in the long-term best interest of the company.

To be fair, the authors disagreed with this idea. They were simply bringing to readers' attention that it was out there. Public companies are owned by shareholders, and those shareholders are represented by the board of directors (whom they vote for). The CEO serves the board on behalf of those shareholders, though admittedly this is a problem when the CEO is also Chairman. As such, the government really has no place to tell boards how to allocate profits from the business that belong to the shareholders. This should be obvious, but evidently it is not to some. The entire activist investor concept is based on the idea that too few times investors pressure boards to act more strongly on their behalf. The system works, and should stay as-is.

The authors, however, do make an assertion of their own that I fail to understand. They claim that the real problem with stock buybacks is that they transfer wealth from shareholders to executives. More specifically, they state:

"Researchers have shown that executives opportunistically use repurchases to shrink the share count and thereby trigger earnings-per-share-based bonuses. Executives also use buybacks to create temporary additional demand for shares, nudging up the short-term stock price as executives unload equity. Finally, managers who know the stock is cheap use open-market repurchases to secretly buy back shares, boosting the value of their long-term equity. Although continuing public shareholders also profit from this indirect insider trading, selling public shareholders lose by a greater amount, reducing investor returns in aggregate."

This paragraph makes no sense, and of course, the authors (a couple of Harvard professors unlikely to have much real world financial market experience) offer up zero data or evidence to support their claims.

So let's address their claims one sentence at a time:

"Researchers have shown that executives opportunistically use repurchases to shrink the share count and thereby trigger earnings-per-share-based bonuses."

This statement implies that a shrinking share count and earnings per share growth are bad, or at least suboptimal. Why? The reason executive bonuses are based, in many cases, on earnings per share, is because company boards are working for the shareholders, and those shareholders want to see their stock prices rise over time. Since earnings per share are the single most important factor in establishing market prices for public stock, it is entirely rational to reward executives when they grow earnings.

"Executives also use buybacks to create temporary additional demand for shares, nudging up the short-term stock price as executives unload equity."

Insiders are notorious for owning very little of their own company's stock. Aside from founder/CEO situations, most CEOs own less than 1% of their company's stock. In fact, many boards are now requiring executives to own more company stock, in order to align their interests with the other shareholders even more. As such, the idea that executives unload stock at alarming rates, and that such actions form the bulk of their compensation, is not close to the truth in aggregate.

In addition, if the stock price is being supported, in part, by stock buybacks, does that not help all investors equally? Just as insiders can sell shares at these supposed elevated prices, can't every other shareholder do the same? At that case, how are the executives benefiting more than other shareholders?

"Finally, managers who know the stock is cheap use open-market repurchases to secretly buy back shares, boosting the value of their long-term equity."

This one makes no sense. Insiders buyback stock when it's cheap?! Oh no, what a calamity! In reality, company's have a poor record of buying back stock when it is cheap and often overpay for shares. Every investor in the world would be ecstatic if managers bought back stock only when it was cheap.

And how are buybacks a secret? Boards disclose buyback authorizations in advance and every quarter the company will announce how many shares they bought and at what price. It is true that such data is between 2 and 14 weeks delayed before it is published, but that hardly matters.

Again, the authors imply that increasing the value of stock is bad for investors, unless those investors are company insiders. In those cases they are getting away with something nefarious. In reality, each shareholder benefits from stock buybacks in proportion to their ownership level (i.e. equally).

"Although continuing public shareholders also profit from this indirect insider trading, selling public shareholders lose by a greater amount, reducing investor returns in aggregate."

Huh? Buying back cheap stock reduces investor returns and hurts public shareholders? I can only assume that the authors simply do not understand as well as they should what exactly buybacks accomplish and what good capital allocation looks like. It is a shame that the Wall Street Journal would publish an opinion so clearly misguided.

What Are Typical S&P 500 P/E Multiples Under More Normal Interest Rate Environments?

The U.S. stock market has been skittish lately, largely on fears of higher interest rates. As new Fed Chairman Jerome Powell takes over for Janet Yellen, and Congress passes multiple pieces of legislation that will swell the budget deficit, investors are getting more nervous about higher rates.

What is amazing about this dialogue is that a 3% yield on the 10-year bond is scaring some people, whereas throughout history 3% would look like a dream come true for equity investors. The issue, of course, is that a 3% 10-year yield is only problematic when the market's valuation has been elevated due to such low rates. It does not really matter if 3% is still low, but rather, if 3% is higher than the 1.5-2.5% range we have seen for many years now.

So let's assume that rates are heading higher and a sub-3% 10-year bond will become a thing of the past over the next year or two (I will not even hazard a guess as to exact timing). The S&P 500 ended 2017 trading at more than 21x trailing 12-month earnings, so that multiple will need to come down as rates rise. But by how much?

Fortunately, we do not have to go back very far in time to find instances of the 10-year bond trading in the 3-5% range. In fact, from 2002 through 2010, it traded in that range most of the time:

During that near-decade long period of time the S&P 500 index traded for between 13 and 20x trailing earnings, with the mean and median both coming out to around 17x. If we use price-to-peak earnings ratios (to smooth out earnings volatility due to the economic cycle (P/E ratios are artificially high during earnings recessions), the mean and medians are around 16x.

So it is fair to say that a more normalized interest rate environment could bring P/E ratios down to around 16.5x, on average, with the 10-year bond yielding 5% or less, but more than it does today. Well, that tells is a lot about where stock prices could trend in coming years. Consider the table below:

SPX-scenarios.png

The consensus forecast for 2018 S&P 500 earnings is about $155 but that could prove a bit optimistic (companies are always very positive about their go-forward prospects when a new year begins). Above I showed a range of $145-$155, which would still represent strong year-over-year growth of 20% at the midpoint (due largely to the recently enacted tax cuts).

You can see that if P/E ratios were to come back down to the 16-17x range, assuming the 10-year yield moved towards 4% by year-end 2018 on the back of 3-4 Fed rate hikes), the U.S. market could be in for some sideways to slightly down price action. Today the market trades for about 19x the current $155 earnings projection.

The good news is that valuation and interest rate normalization should not, in and of itself, be hugely detrimental to stock prices as long as earnings hold firm. Assuming no recession, my worst case scenario would probably be a 16x multiple on $145 of earnings (S&P 500 at 2,320), which while not a fun path to take, would only represent about 8.5% additional downside relative to the market's recent low earlier this month.  That is not exactly a super-scary outcome, and it probably is not even the most likely base case scenario. Buyers could easily come in at 17x earnings and if profits reached $150 this year, that would mean we have already seen the low point for the S&P 500 this year. 

Momentum Trading Cuts Both Directions

Back on Monday October 19, 1987, the Dow fell 508 points, which was a decline of more than 22% in a single day. Today that same decline equates to roughly 2%. With the Dow trading at such high levels, in absolute point terms, a large decline might seem scary if not presented in percentage terms. The same is true when the financial media likes to focus on every 1,000 Dow points, as if a move from 25,000 to 26,000 is anything more than a simple 4% gain that historically takes less than 6 months, on average.

So rather than care about "a 1,000 point Dow decline!" let's look at a one-year chart of the S&P 500 for some perspective:

SPX-FlashCrash.png

As you can see, all we have done over the last two days, when the Dow has dropped 1,600 points, is give back the gains booked in January! When I look at this chart, I don't see the mother load of all buying opportunities yet. I probably would not get even a little bit giddy about buying U.S. stocks unless we got back down to 2,400 or 2,500. That does not mean it will get there, or that I think it might (I -- like anybody else -- have no clue).

Momentum markets work in both directions, and when computerized algorithms conduct much of the daily trading in the stock market, moves like we see today can happen with ease, and most importantly, without tangible "reasons" behind them.

Most of the time I wish we could go back to the days when stocks were less volatile, a 10% correction occurred about once a year, on average, and the media did not over-hype days like today. It will make for good, scary headlines, but that's about it.

U.S. Stocks Reach Valuations Rarely Seen, Making Material Earnings Growth A Requirement For Strong Future Returns

In the face of the current highly ebullient stock market, close watchers of valuation metrics are frequently dismissed as ignoring the prospect for accelerating GDP growth and lower corporate tax expense, but I will step onto that turf anyway. It may make me look foolish, as Warren Buffett recently played down concerns about the market's valuation, even though his often-preferred metric in years past (total stock market value relative to annual GDP) is dangerously high, but that's okay.

Here is a look at my preferred valuation metric; a variant of the P/E ratio that uses "peak earnings" (the highest level of corporate profits ever produced in a 12 month period) instead of trailing 12 month earnings (impacted solely by the current economic environment) or forward earnings estimates (usually overly optimistic). We'll go back more than 50 years, not only to get an idea of historical trends, but also because that is the data I have.

SPX-PeakPE-1960-2017-March.png

When people ask me about my view of the market, I tend to give a tempered response because it is hard to argue that we should really get any earnings multiple expansion. After all, we now sit above 20 times "peak earnings" and that has only happened once in the last 55 years. As you can see, that one time (the dot-com bubble of the late 1990's) is not exactly a time we probably want to emulate this time around.

It is important to note that high valuations do not guarantee poor future returns. There is a high correlation, but you can map out mathematical scenarios whereby P/E ratios mean-revert and stock prices don't crater. Simply put, it requires extraordinary earnings growth that can more than offset a decline in P/E ratios (which we should expect if interest rates continue to increase). Right now the U.S. market is banking on this outcome, so earnings and interest rates are probably the most important things to watch in coming quarters and years when trying to gauge where the market might go from here.

Author's note: The use of "peak earnings" is not common, so it is worth offering a brief explanation for why I prefer that metric. Essentially, it adjusts for recessions, which are temporary events. If investors use depressed earnings figures when they value the market, they might conclude stocks are not undervalued even if prices have declined materially. This is because they inherently assume that earnings will stay low, even though recessions typically last only 6-12 months and end fairly abruptly.

As an example, let's consider the 2008 recession. The S&P 500 fell 38% that year, from 1468 to 903. S&P earnings fell by 40%, from ~$82 to ~$50. If we simply use trailing 12-month earnings, we see that the P/E multiple on the index was 18x at the beginning of 2008, and was also 18x at the end of the year. So were stocks no more attractively priced after a near 40% fall? Of course they were, but using traditional P/E ratios didn't make that evident.

If we instead used "peak earnings" (which were attained in 2006 at ~$88), we would have determined that the market was trading at ~17x at the outset of 2008 and had fallen to just 10x by the end of the year. By that metric, investors would have realized that stocks were a screaming buy when the S&P traded below 1,000.

Dow 20,000: Just A Number

How about that? Dow 20,000! What a hugely important milestone! Right? Well, not really.

Sure it will make for a good front page story in USA Today tomorrow, and those few humans who are still needed on the trading floor of the New York Stock Exchange (they've been largely replaced by machines) will unpack the Dow 20K hats for sure, but Dow 20,000 is no more important than Dow 18,763.

When the Dow Jones Industrial Average is this high, we actually would expect new milestones to be reached on a very regular basis. An average stock market year (+10%) would actually see us break through another 1,000 point level every six months. Even if we stretch the milestone interval to 5,000 points, it will only take two and a half years on average.

In fact, it only took 18 years from 10,000 to 20,000. That might sound like a long time for the index to double (it's only a 4% average return during that time), but that period includes the massive dot-com market collapse of 2000-2002, as well as the Great Recession of 2008-2009.

Here is a calendar breakdown of Dow Jones milestones:

dow20k.png

As you can see, every milestone from Dow 3,000 through Dow 20,000 has occurred since the 1990's. Dow 1,000 --- now that was a milestone... it took 76 years from the index's creation in 1896 for it to pierce the 1,000 level!

Also of note is how the Dow itself has become less and less relevant over time for investors. Most of us use the S&P 500 index since it represents more broadly diversified group of public companies, versus just 30 for the Dow. This is also because the S&P 500 is value-weighted, meaning that a company worth $10 billion comprised twice as much of the index as a $5 billion company.

The Dow, on the other hand, is share price-weighted. So while Bank of America (market value $235 billion) is ~2.5 times larger than Goldman Sachs (market value ~$95 billion), it actually makes up far less of the Dow's composition than Goldman does. In fact, BofA's share price is only 1/10th that of Goldman, so a $1 increase in GS stock (which is a gain of 0.4%) adds the same amount of points to the Dow as a $1 increase in BofA stock (a gain of 4%) does. It's really a bizarre methodology.

Despite all of that, I'm glad we are getting 20K out of the way so we can stop hearing about it. That is, of course, until we hit Dow 25K, which history suggests is most likely to happen in just a few years. 

Trump Stock Market Rally Staring Down Formidable Opponent: Valuation

With the U.S. stock market having rallied 5% since Election Day, many investors are very enthusiastic about President-Elect Trump’s clear agenda of filling his Cabinet with wealthy business people who will be tasked with creating an optimal business environment for American companies. Slashing regulations, cutting corporate tax rates, and incentivizing profits earned overseas to be repatriated back to the U.S. will certainly put a jolt into Corporate America. Perhaps even more crucial to the recent stock market rally is the fact that infrastructure spending and corporate tax cuts are likely to be funded with additional borrowings by the federal government. As a result, we have seen a steep increase in interest rates over the last month, which has led many traders to sell bonds and reallocate that capital into stocks.

But after that asset reallocation is over, then what? Count me as skeptical that this market rally will continue for the next four years. I see two main headwinds that are likely to creep into the picture beginning in 2017; lofty legislative expectations for the Republican-controlled Congress and elevated stock market valuations.

First, there is likely to be a gap between what legislation is actually passed in 2017 and the “best-case scenario” that stocks seem to be banking on today. Dreams of a $1 trillion infrastructure spending program coupled with large personal tax cuts, as well as a reduction in the corporate tax rate from 35% all the way down to 15%, will cost a lot of money. As in trillions of dollars. Where does this money come from?

President Obama has been able to reduce the federal government’s annual budget deficit by more than 50% since he took office, but the U.S. is still spending more than half a trillion dollars more each year than it is bringing in from taxes. There are likely many Republicans who are concerned enough about our country’s finances that they would be unwilling to vote for a material increase in the budget deficit. In that scenario, $1 trillion of spend on infrastructure spending does not work. Corporate tax rates fall to 20-25% instead of 15%, and large personal tax cuts become quite small (remember George W Bush’s $300 per person tax cut in 2001?). A more subdued legislative result would limit the rush of cash into personal and corporate pockets that many are hoping for. Simply put, expectations might be too high.

Even more concerning for the stock market are current valuations. Right now the S&P 500 index trades for roughly 20.5 times estimated earnings for calendar year 2016. The average trailing 12 month price-earnings multiple over the last 50 years is 16 times. Market bulls are quick to point out that interest rates are sitting at below average levels, so stocks deserve to trade at above-average prices. That may be true, but interest rates are on the rise and over the last five years, as interest rates reached record low levels, the S&P 500 index traded between 15 and 20 times trailing earnings. As interest rates rise, stock valuation multiples should go down, not up.

This chart shows year-end price-earnings ratios for the S&P 500 index going back more than 50 years. To smooth out the downward volatility seen during recessions, I used “peak earnings” (highest ever recorded) as opposed to “current earnings” (t…

This chart shows year-end price-earnings ratios for the S&P 500 index going back more than 50 years. To smooth out the downward volatility seen during recessions, I used “peak earnings” (highest ever recorded) as opposed to “current earnings” (trailing 12 months). The consensus for 2016 earnings is to get within ~3% of the profit peak, which was in 2014 before oil’s big drop.

Simply put, price-earnings ratios are likely to trend downward over the next few years. In order for stock prices to continue their march higher, corporate profits would really need to grow quickly. If legislative action on that front disappoints in 2017, the current market optimism could very well die down quickly. Normally, Trump’s election could very well have marked the beginning of a prolonged bull market in stocks, due to his desire to put business leaders in powerful positions (the underlying assumption being that these folks will be more friendly to business than any other constituency). The big headwind to that theory this time around is that during President Obama’s two terms in office, the Dow Jones Industrial Average has soared from below 8,000 to over 19,000. As a result, the old adage that “trees don’t grow to the sky” seems particularly relevant, no matter the legislative agenda.

That is not to say that markets are going to reverse course and move dramatically lower. I think a more likely outcome is that P/E ratios move from 20-21x to 16-18x and corporate profits grow at a 5-10% annual clip. In that scenario (7.5% annual profit growth and a 17x P/E), the S&P 500 index in four years would be trading around 2,475, or roughly 10% above current levels. Not a terrible outcome, but hardly robust either.

U.S. Stock Market Post-Brexit: The Beat Goes On

Friday's somewhat surprising Brexit vote (given that the polls showed both sides neck in neck, I cannot agree with the media that a 52-48 vote was a "shock") reminds me a lot of the financial market turmoil that was brought on by Greece's tumult several years ago. The fear was always about a European contagion rather than a huge impact from the main event. As I reminded people back then, Greece is roughly the size of Ohio and therefore we could extrapolate its ultimate impact on the rest of the world to have its limits. The U.K. is definitely larger in population than Greece (about the size of California and Texas combined), but it remains a small sliver of the globe.

As was the case then, the Brexit vote is going to have its biggest impact locally as the U.K. tries to figure out exactly what it means and how to tread slowly in order to minimize economic disruption. Companies doing business in Europe will have to contemplate their next steps, but by and large it should be business as usual for most players in the region. The stock market reaction has been interesting because one can point to obvious losers where substantial market devaluations seem warranted (U.K. banks, for instance), but also many that seem to be painted with the guilt by association brush. Anheuser Busch InBev (based in Belgium) and Shire (based in Ireland) each fell by 5-10% on Friday despite the fact that sales of beer and pharmaceuticals should be unaffected (in fact, perhaps alcohol consumption in the region sees a tick upwards in coming months). Those types of investment scenarios might be ripe for picking.

Other areas are worth watching too. U.S. commercial and investment banks are actually very healthy these days after taking dramatic capital raising measures post-housing crisis. If one was looking for a chance to buy well-run firms such as JP Morgan or Goldman Sachs on sale, the current drops might look quite appealing. For those brave souls who want to scour the U.K. for riskier options (not a task I plan on undertaking, simply due to my lack of knowledge of the region), there will not be a shortage of opportunities to ponder. After all, British Telecom has lost 25% of its value over the last two days, despite operating a business traditionally seen as fairly defensive in nature. A bank it is not.

With the U.S. market only down about 6% from its all-time high, I think it is too early to be either overly worried or overly eager to gobble up stock bargains. Consider that the crash of 1987 was a 500 point decline that equated to 23% of the market's value. Friday's 600 point drop was a little more than 3%.

Keeping Perspective: S&P 500 Corrections Since 2010

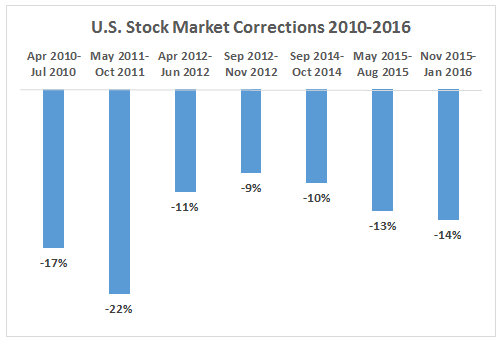
Has January 2016 been rough for stock market investors? Absolutely. One of the most important things to do, in my view, is to keep perspective and not make swift, emotional changes during times like these. With the help of the media, many investors see this kind of drop in such a short time (10% in a few weeks) and immediately think back to 2008. That financial crisis was the worst recession in 80 years. It is not a common occurrence. What is common are regular market corrections triggered by some macroeconomic event that are characterized by stock prices reacting far worse than underlying economic and corporate performance would indicate is rational. That is very likely what we are seeing right now. In fact, it might surprise people that we have actually witnessed many such events just since 2010. SPX-drops-2010-2016

For long-term investors (time horizon of 3-5 years or more), these are almost always opportunities to buy rather than sell.